Poster

Highly Efficient Engineering of Difficult-to-Transfect Immune Cells Using MaxCyte® Electroporation

Abstract

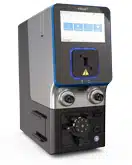
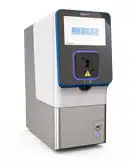
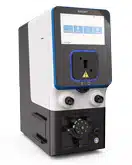
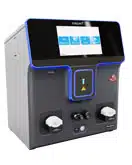
Since their inception, cell-based therapies have emerged as promising treatments for a wide range of diseases. Immune cells such as T cells, NK cells and macrophages are being used to treat various cancers, autoimmune disorders and degenerative diseases. To engineer these cells for improved efficacy and safety, biomolecules and other genome-editing tools must be delivered into these difficult-to-transfect cells. To this end, MaxCyte has developed optimized cell engineering workflows using the ExPERT™ electroporation platform that enable highly efficient delivery of molecules, such as RNA, DNA and CRISPR-Cas nucleases, into a variety of cell types. Here, we demonstrate that these workflows can be used to engineer primary human immune cells to express tumor-targeting receptors while maintaining high cell viabilities and functionality. In particular, MaxCyte enabled transient and stable expression of CARs/TCRs in T cells, NK cells and macrophages through high-efficiency transfection of mRNA, DNA encoding transposons/transposases, or CRISPR ribonucleoproteins (RNPs) and homology-directed repair (HDR) templates into these hard-to-transfect cells. In addition, these workflows seamlessly scaled up, allowing these cells to be engineered at therapeutically relevant scales.

CD19 CAR mRNA engineering of primary immune cells using MaxCyte electroporation

A) Workflow with ExPERT GTx®

Illustration of three-stage workflow for engineering T cells, NK cells and macrophages using the ExPERT GTx. Stage 1: isolation, activation/expansion of cells. 2: CD19 CAR mRNA electroporation. 3: downstream analysis, showing effective transfection with instrument.

B) Transient CAR expression in T cells
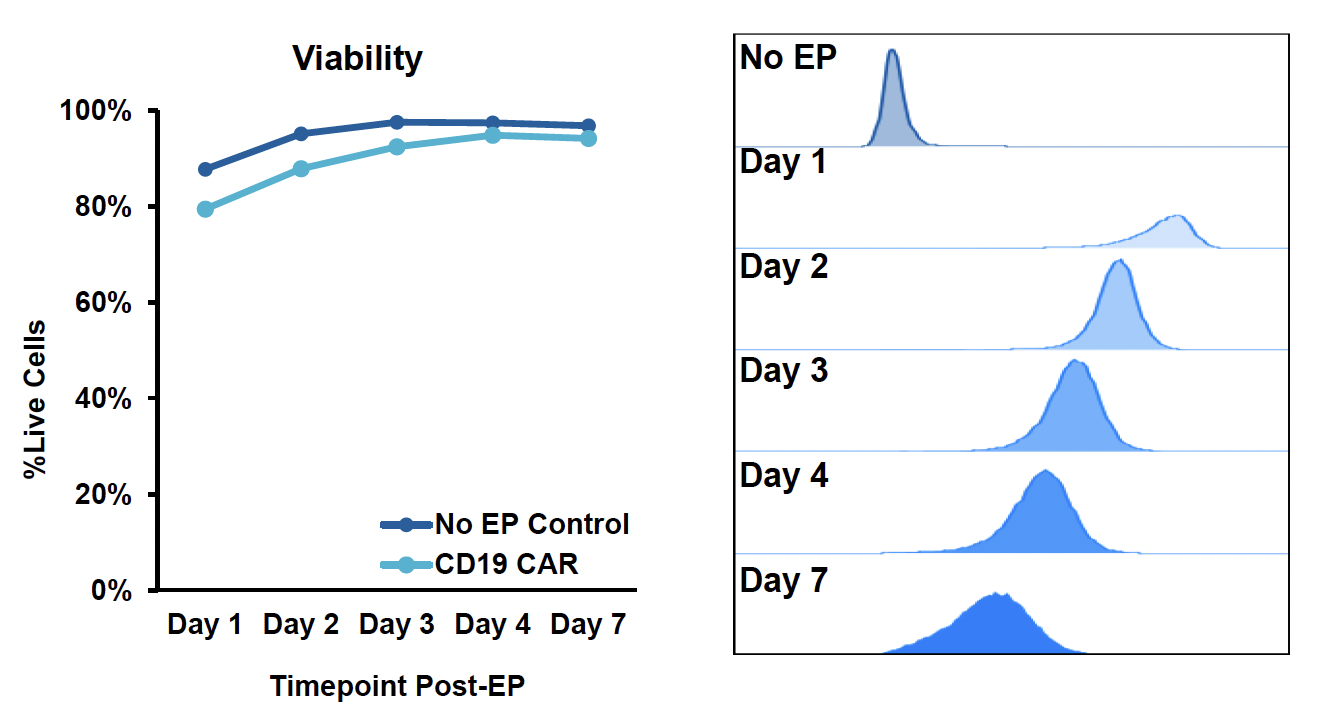
A point graph (left) shows percentage of T cell viability for seven days after electroporation. One line shows above 90 percent viability without electroporation control, and the other shows a slightly lower but similar viability for CD19 CAR. Bell curves by days one through seven (right) show high cell viability with electroporation.

C) CAR mRNA engineering of primary NK cells
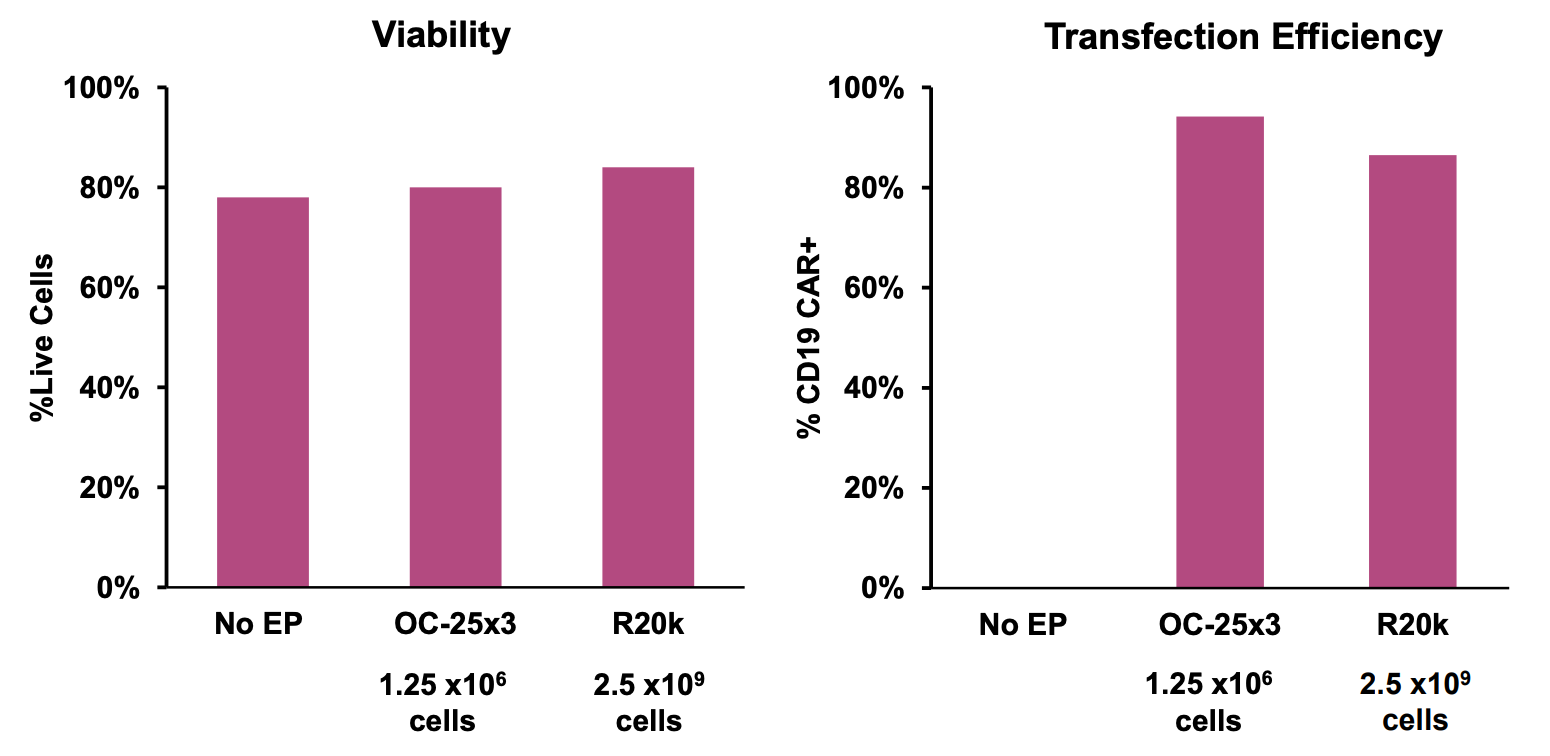
Two pink bar graphs: Left shows about equal viability (~80% or higher) with no electroporation, small-scale static processing assembly and large-scale flow processing assembly. Right graph shows transfection efficiency for no electroporation (no transfection), small-scale and large-scale assemblies, with small-scale about 10% more efficient than the larger-scale but both over 80 percent.

D) CAR mRNA engineering of monocyte-derived macrophages
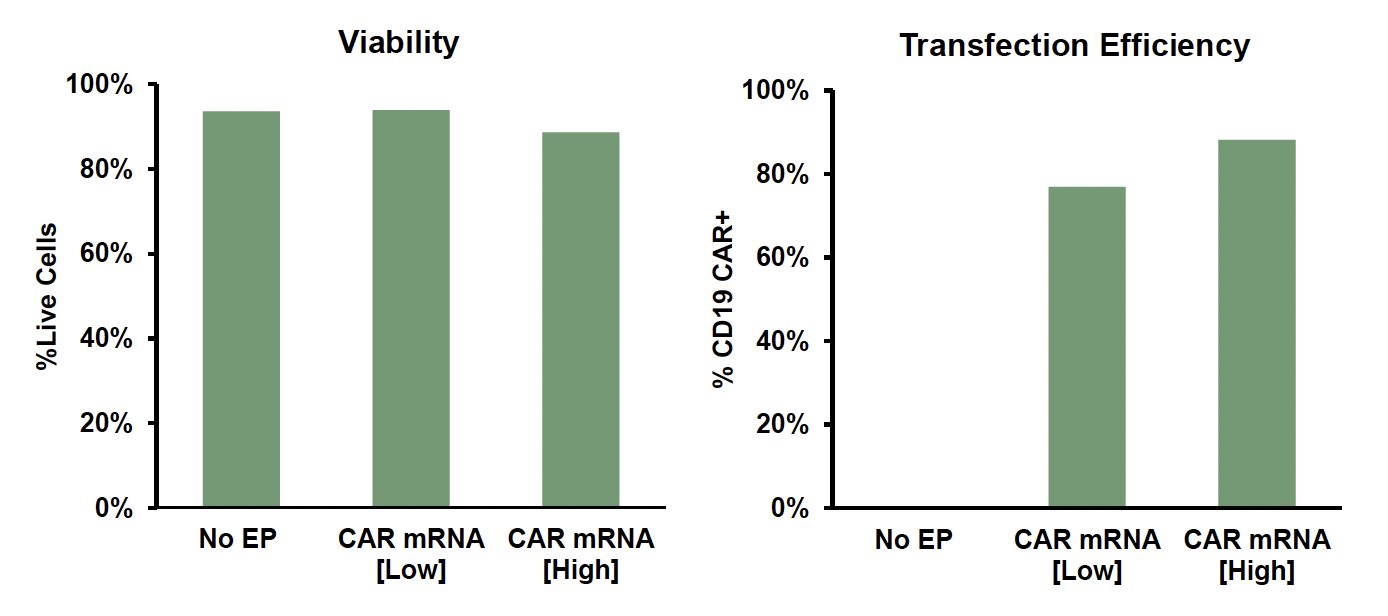
Two bar graphs: Left shows about equal viability (90% or higher) with no electroporation, low CAR mRNA (low) and high CAR mRNA. Right shows transfection efficiency (percentage of CD19 CAR+) for no electroporation (no transfection), low CAR mRNA and high CAR mRNA, with the latter being the highest by about 10 percent.

Figure 1: A) General workflow for engineering primary human immune cells with CD19 CAR mRNA electroporated using the ExPERT GTx. B) T cells were isolated and activated prior to transfection. CD19 CAR-T cells were expanded, and transfection efficiency and cell viability was examined over a seven-day period after electroporation (EP) by flow cytometry. C) NK cells were isolated and expanded for 14 days using a feeder-free culture method. Expanded NK cells were electroporated using either a small-scale OC-25x3TM (static) processing assembly or a large-scale R20k (flow) processing assembly. Transfection efficiency and cell viability were examined 24 hours post EP by flow cytometry. D) Monocytes were isolated and differentiated into macrophages for seven days and subsequently transfected with either a high or low concentration of CD19 CAR mRNA. Transfection efficiency and viability were examined 24 hours post EP by flow cytometry.

Engineering CD70-directed CAR NK cells for treatment of hematological and solid malignancies

A) Workflow with ExPERT ATx®

Illustration of ATx workflow. A pink cluster of cells shows NK cells co-cultured with feeder cells and IL-2. Then in the multiplex gene modification, a squiggling blue strand turning into As (Cas9), a blue line with teeth like a comb (gRNA), a circle graphic (CD70 transposon, and a green squiggling strand turning into As (transposase ) are added to the NK cell cluster and electroporated, as illustrated by the ATx instrument. Following that, in expansion, a small cluster of CAR-NK cells (still pink) with animated flags or markers expand into the next image of a larger cluster of CAR-NK cells.

B) CAR expression in engineered NK cells compared to controls

Three bar graphs showing CAR expression by percent (first two) and CD70 expression by percent(last). CAR expression in engineered NK cells was characterized with either anti-CD27 antibody (CD27 receptor detection) or recombinant CD70 protein (scFv detection). Controls include plasmid only, CD70 KO only and anti-CD19 CAR+CD70 KO. All data points represent individual donors.

C) Cytotoxicity, degranulation and cytokine expression after co-culturing of engineered NK cells with target cells

Four bar graphs showing percentage of cytotoxicity, degranulation (CD107a), IFNγ (ICS), and TNFα (ICS) after co-culturing of engineered NK cells with target cells. All data points represent individual donors.

Figure 2: A) Schematic workflow of primary human NK cells electroporated with TcBuster™ transposase-mRNA, CD70 CAR transposon plasmid DNA, mRNA-encoding Cas9 and a CD70 sgRNA using an ExPERT ATx®. Primary NK cells were co-cultured with engineered feeder cells and IL-2. B) CAR expression in engineered NK cells was characterized with either anti-CD27 antibody (CD27 receptor detection) or recombinant CD70 protein (scFv detection). Controls include plasmid only, CD70 KO only and anti-CD19 CAR+CD70 KO. All data points represent individual donors. C) Engineered NK cells were co-cultured with luciferase-expressing CD70-positive NOMO-1 (AML) target cells; cytotoxicity, degranulation and cytokine expression were characterized. All data points represent individual donors, and error bars represent standard deviation.

This content was reproduced with kind permission from Catamaran Bio Inc.

MaxCyte enabled development of rapid and reproducible manufacturing of TranspoCART cells

A) Workflow with ExPERT GTx

Illustration of GTx workflow over 13 days. Day zero: Image of human figure with IV bag indicates isolation of CD4/CD8 T cells from patient and activation of cells (with CD3/CD28 +IL7 +IL15) is represented as a test tube image. Day 2: CAR minicircle transposon is represented by a wheel graphic, sleeping beauty transposase mRNA by a squiggling strand leading into As, and a cluster of blue cells, which represents the T cells. These are then electroporated in the GTx instrument, depicted in the illustration. Day 3-13: a clear enclosure shows the Gas Permeable Rapid Expansion via G-Rex with a cytokine addition (+IL7/IL15). Day 13: a snowflake icon indicates cryopreservation.

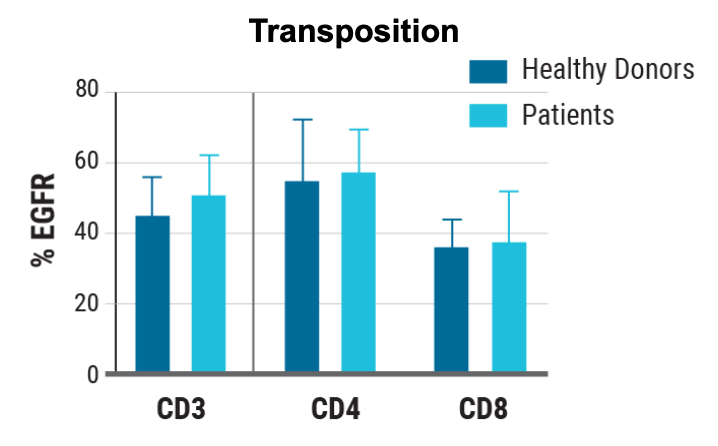
B) Rate of transposon insertion

Bar graph shows percentages of EGFR for CD3, CD4, and CD8, for both healthy donors (dark blue bars) and patients (light blue bars). CD3 was between 45 and 50 percent, CD4 between 50 and 55 percent, CD8 a little less than 40 percent.

C) TranspoCART expansion

Plot graph shows TRANspoCART expansion between healthy donor (dark blue) and patient (light blue) samples.

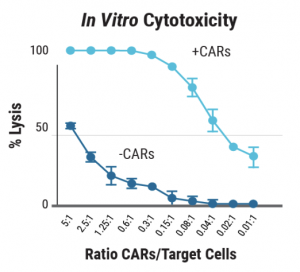
D) In vitro cytotoxicity

Plot graph: TranspoCART cells from patients showed in vitro cytotoxicity against a CAR target-expressing cell line.

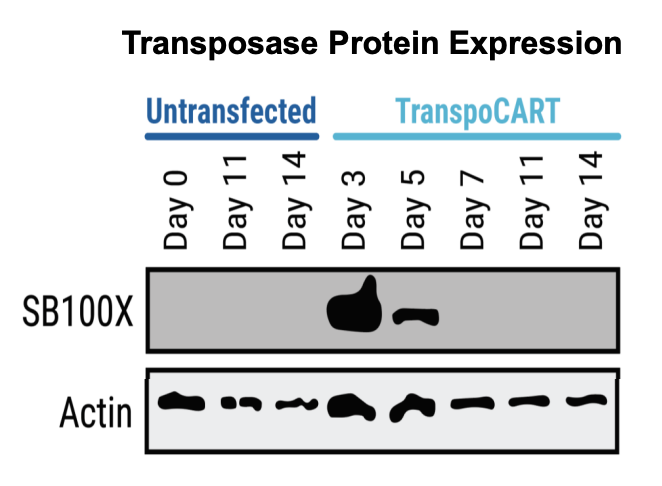
E) Western blot analysis

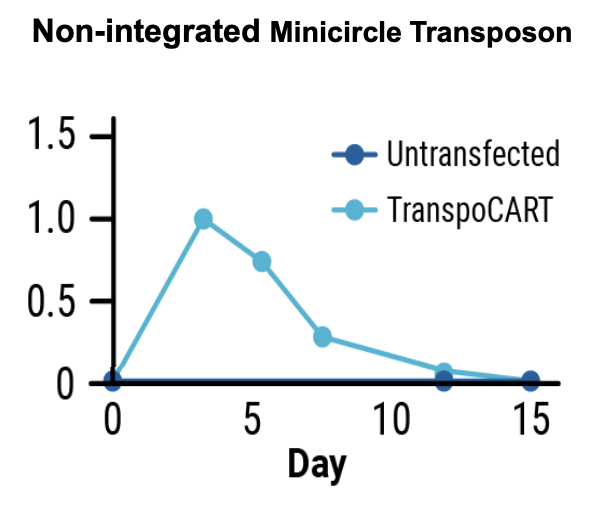
Western blot analysis shows transposase protein and unintegrated minicircle transposon DNA were undetectable by days seven and 15 after electroporation.

B) Quantitative PCR

Quantitative PCR analysis shows transposase protein and unintegrated minicircle transposon DNA were undetectable by days seven and 15 after electroporation.

Figure 3: A) Primary human T cells were electroporated with Sleeping Beauty 100X mRNA transposase and transposon minicircle DNA encoding a CAR and truncated human EGFR (tEGFR). Expression of tEGFR was used as a marker for successful transposon insertion and as a safety switch, enabling TranspoCART cells to be targeted and depleted on treatment with anti-tEGFR antibodies. No differences in B) the rate of transposon insertion or C) TranspoCART expansion were seen between healthy donor and patient samples. D) TranspoCART cells from patients showed in vitro cytotoxicity against a CAR target-expressing cell line. E) Western blot analysis and F) qPCR showed transposase protein and unintegrated minicircle transposon DNA were undetectable by days seven and 15 after electroporation.

Data generated in collaboration with CIMA/Clinica Universidad de Navarra and CIEMAT. Adapted with permission.

Engineering TCR-T cells for immunotherapy of hepatocellular carcinoma

A) Workflow with ExPERT GTx

Illustrated workflow of primary activated human T cells (depicted as clusters of blue cells) being expanded then electroporated with a green squiggling strand merging into a list of As depicting TCR mRNA. Once out of the ExPERT GTx instrument shown, the cluster of blue cells shows red markers or flags to indicate TCR-T cells before cryopreservation (a snowflake icon). The downstream analysis shows thawed TCR-T cells, which are also represented by a cluster of blue cells with red markers or flags.

B) TCR expression and viability by processing assembly and time post electroporation
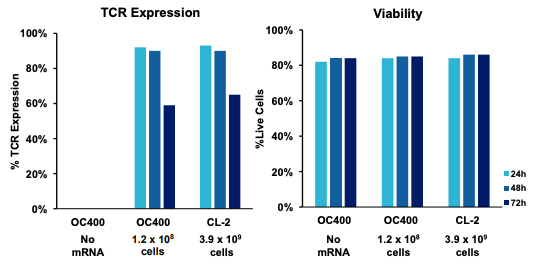
Two bar graphs. Left graph shows TCR expression by percent over three different electroporation (EP) conditions: no mRNA, 1.2x10⁸ cells, and 3.9x10⁹ cells (flow electroporation). Three different colored bars represent time analyzed after transfection: the light blue bar is 24 hours, dark blue is 48, and navy is 72. No mRNA was zero percent for all times, and the other two conditions yielded similar results, the highest at 24 hours (~90 percent) and lowest at 72—between 60 and 70 percent. Right graph shows the same except cell viability by percent over different conditions. Cell viability remained above 80 percent for all conditions.

C) TCR expression and viability over culture time
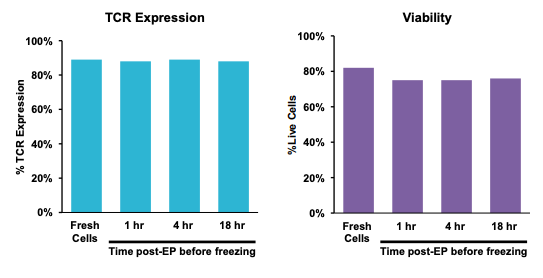
Two bar graphs show four groups of electroporated cells over time post EP but before freezing. The first group was cultured for 24 hours at 37°C and analyzed by flow cytometry. The remaining three cell groups were cultured at 37°C for one, four and 18 hours after transfection, and then cryopreserved. Left graph shows TCR expression by percent for each time. Expression remains near 90 percent at every point. Right graph shows the same but for viability, with percent of live cells over time. Fresh cells were at 80 percent, and remained above 80 percent for remaining times.

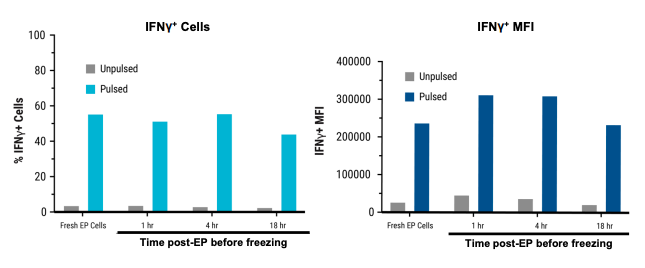
D) IFNγ expression over time

Two bar graphs. Left graph shows IFNγ expression by percent for unpulsed (gray bar) and pulsed (light blue bar) cells over time up to 18 hours post electroporation and before freezing. Right graph shows IFNγ+ MFI up to 400000 for unpulsed (gray bar) and pulsed (dark blue) cells. Pulsed far higher over time compared to unpulsed, which remains close to y axis.

Figure 4: A) Schematic workflow of primary activated human T cells electroporated with TCR mRNA using an ExPERT GTx®. B) Primary activated T cells were electroporated with TCR mRNA in MaxCyte static (OC-400 TM) or flow (CL-2 TM) processing assemblies (PAs). The total number of T cells electroporated in the OC-400 and CL-2 was 1.2x10⁸ and 3.9x10⁹, respectively. T cells were analyzed 24, 48 and 72 hours after transfection by flow cytometry. C) Electroporated cells were divided into four groups. The first group was cultured for 24 hours at 37°C and analyzed by flow cytometry. The remaining three cell groups were cultured at 37°C for one, four and 18 hours after transfection, and then cryopreserved. After thawing, these three cell groups were cultured and then analyzed for TCR expression and viability. D) TCR expressing lymphocytes were co-cultured with antigen peptide-pulsed T2 cells and analyzed by flow cytometry for IFNγ expression.

This content was reproduced with the permission of Lion TCR.

CRISPR RNP and ssDNA co-electroporation in activated T cells for efficient CAR knockin

A) Visual summary of ExPERT GTx co-electroporation
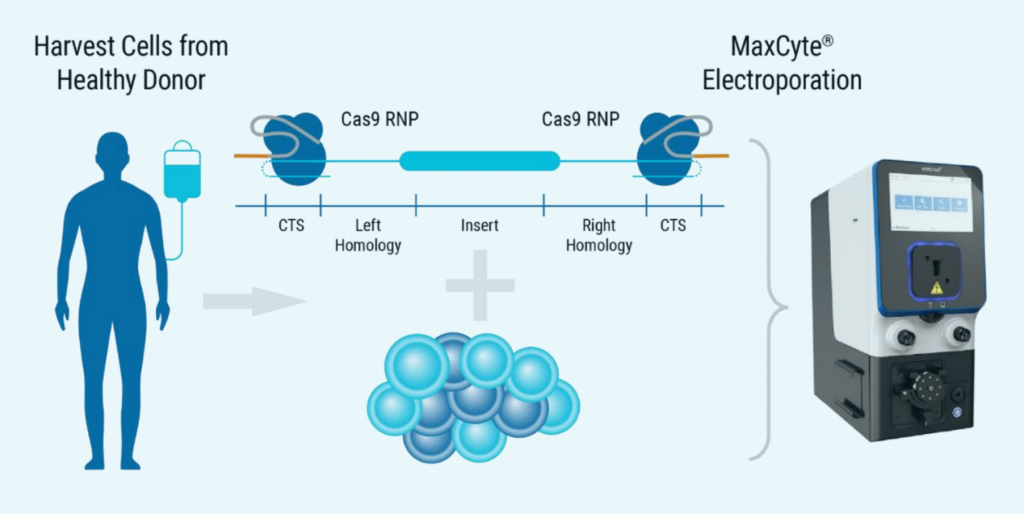
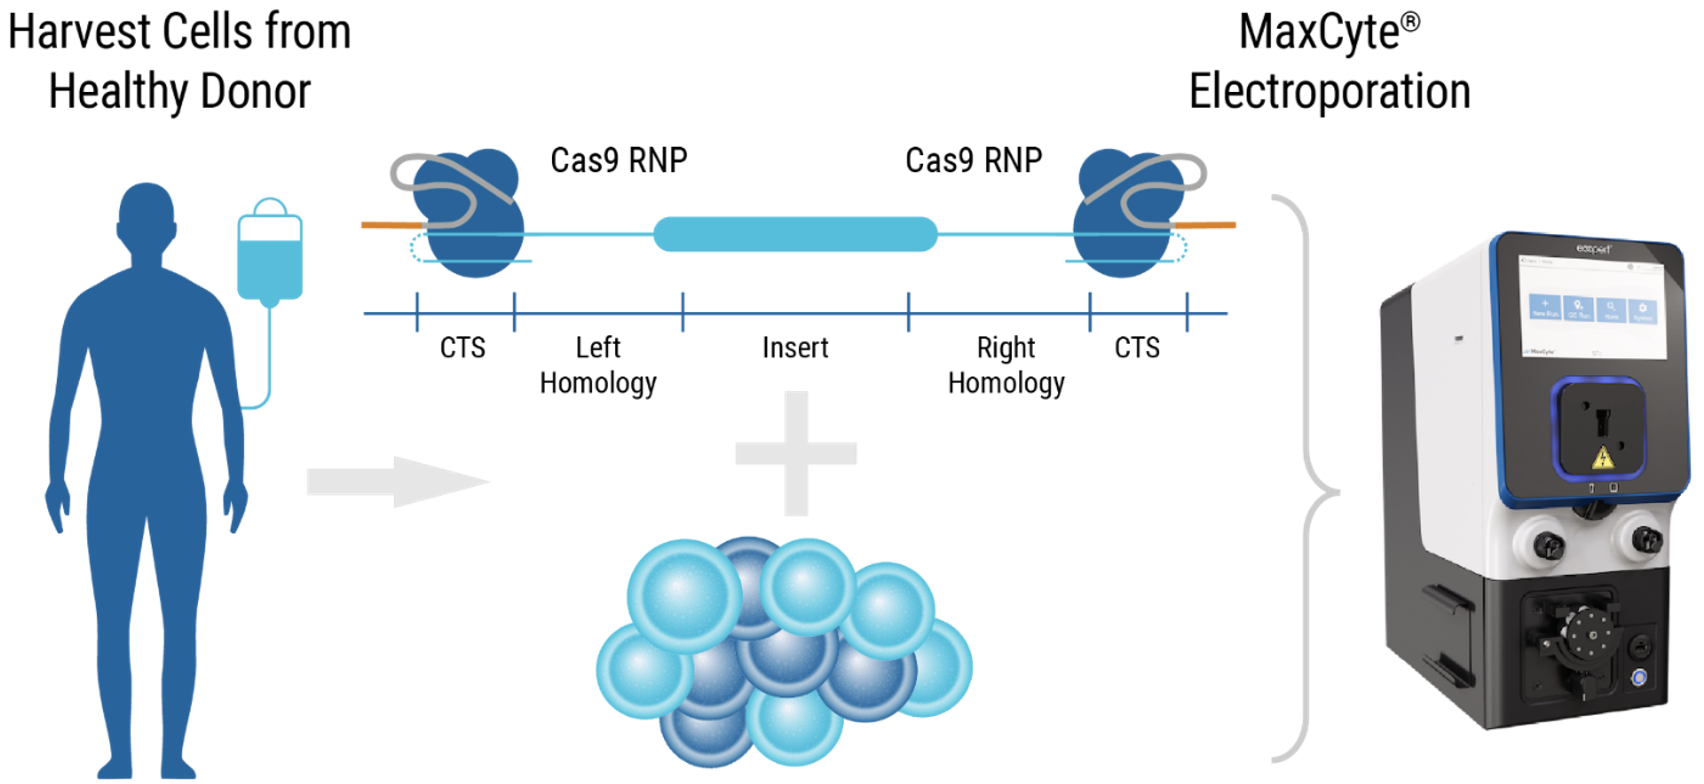
The left of the illustration shows an image of a human figure and IV bag to represent harvest cells from healthy donor and the right shows an image of the ExPERT GTx®. Between them is a depiction of CRISPR RNP + ssCTS template being delivered to the TRAC locus of activated T cells.

B) KI efficiencies of BCMA-CAR days 7 and 10 of manufacturing

Bar graph showing knockin efficiencies up to 60 percent of BCMA-CAR on days seven and 10 of manufacturing protocol. Three different colored bars: the dark blue is the control, with no inhibitor; the light blue is labeled M for M3814M DNA-PK inhibitor, and the purple is labeled MT for M + histone deacetylase class I/II Inhibitor. M and MT are both around 60 percent knockin at day 7 and 10, while the control is about 40 and 45 percent, respectively.

C) Number of CAR+ T cells on days 7 and 10 of manufacturing
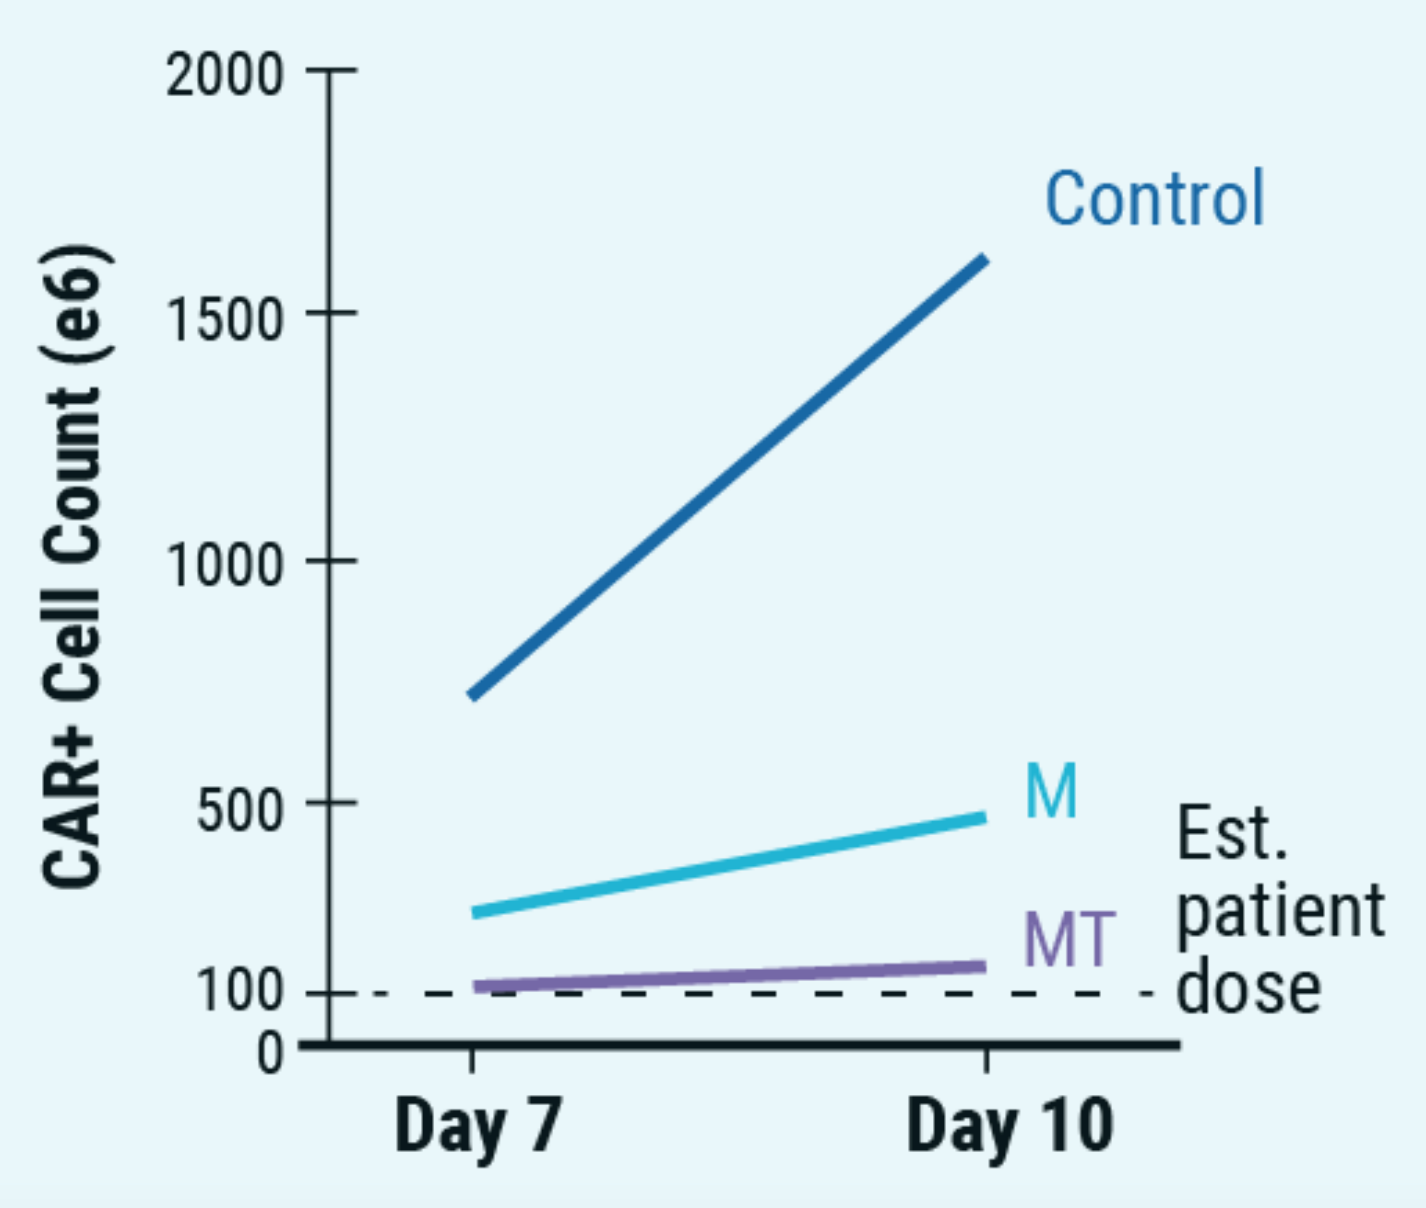
Line graph shows total number of CAR+ T cells (e6) up to 2000 on days 7 and 10 of manufacturing protocol. Dotted horizontal line at 100 CAR+ T cell count is estimated patient does of 1x10⁸ cells. Three lines signify the control (dark blue line), M3814M DNA-PK inhibitor (M, light blue line), and M + histone deacetylase class I/II Inhibitor (MT, purple line). The control line goes from about 750 cell count at day 7 to over 1500 at day 10. M line (light blue) goes from about 250 to 500. MT is nearly aligned with estimated patient does line, going from 100 at day 7 to slightly over 100 at day 10.

D) Flow plots of BCMA-CAR KI efficiencies
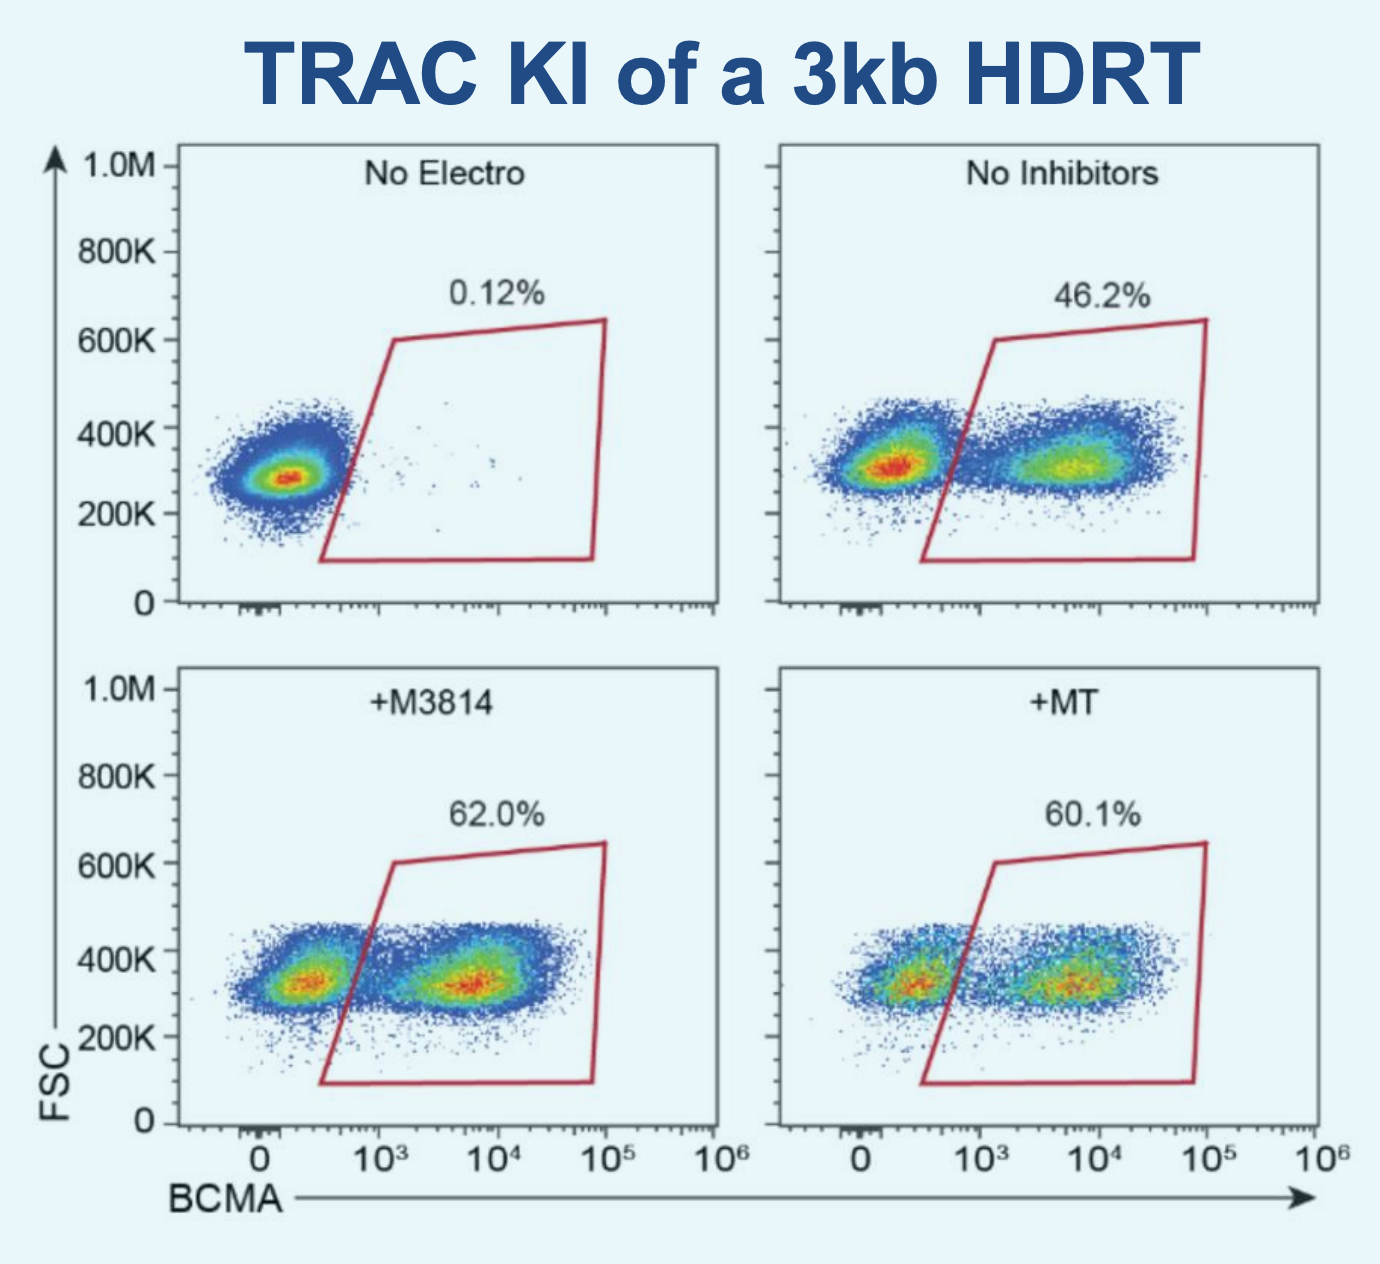
Four flow plots of BCMA-CAR knockin efficiencies (FSC from 0 to 1M over BCMA from 0 to 108) for each condition on day 10. From top left quadrant clockwise: no EP is 0.12%, no inhibitors is 46.2%, +M3814 is 62.0%, and +MT is 60.1%.

E) Percent target of myeloma cell killing over effector target ratio
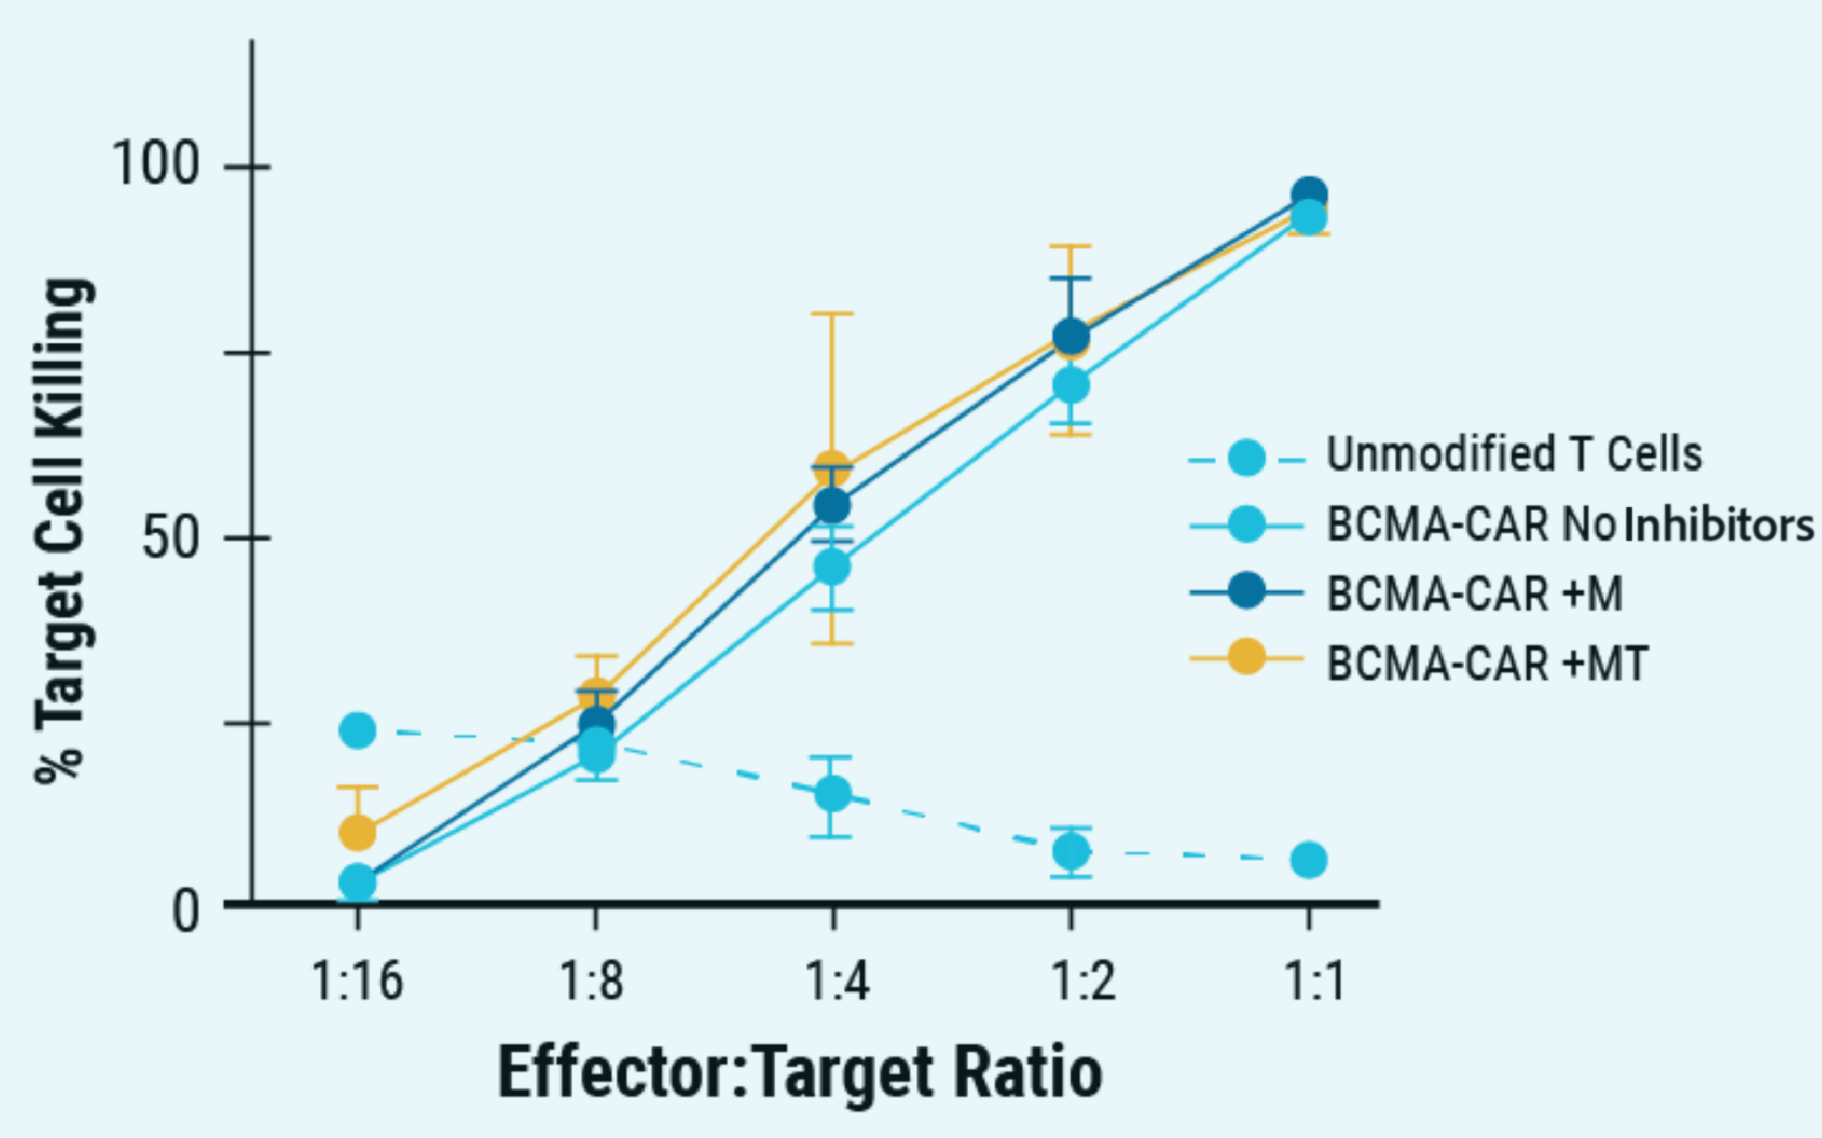
Linear plot graph shows percent target of BCMA-expressing myeloma cell lines killed over effector: target ratio up to 1:1. Four lines: Unmodified T cells are tracked by dashed light blue line, BCMA-CAR no inhibitors by filled light blue line, BCMA-CAR +M by dark blue, BCMA-CAR +MT by yellow. All lines besides unmodified rise at about 45 degrees, while the unmodified line goes down from about 25 percent to nearly 0 percent: BCMA-expressing multiple myeloma cell lines were effectively targeted and killed by engineered CAR T cells compared to unmodified.

F) Overall survival over day post tumor seeding when treated
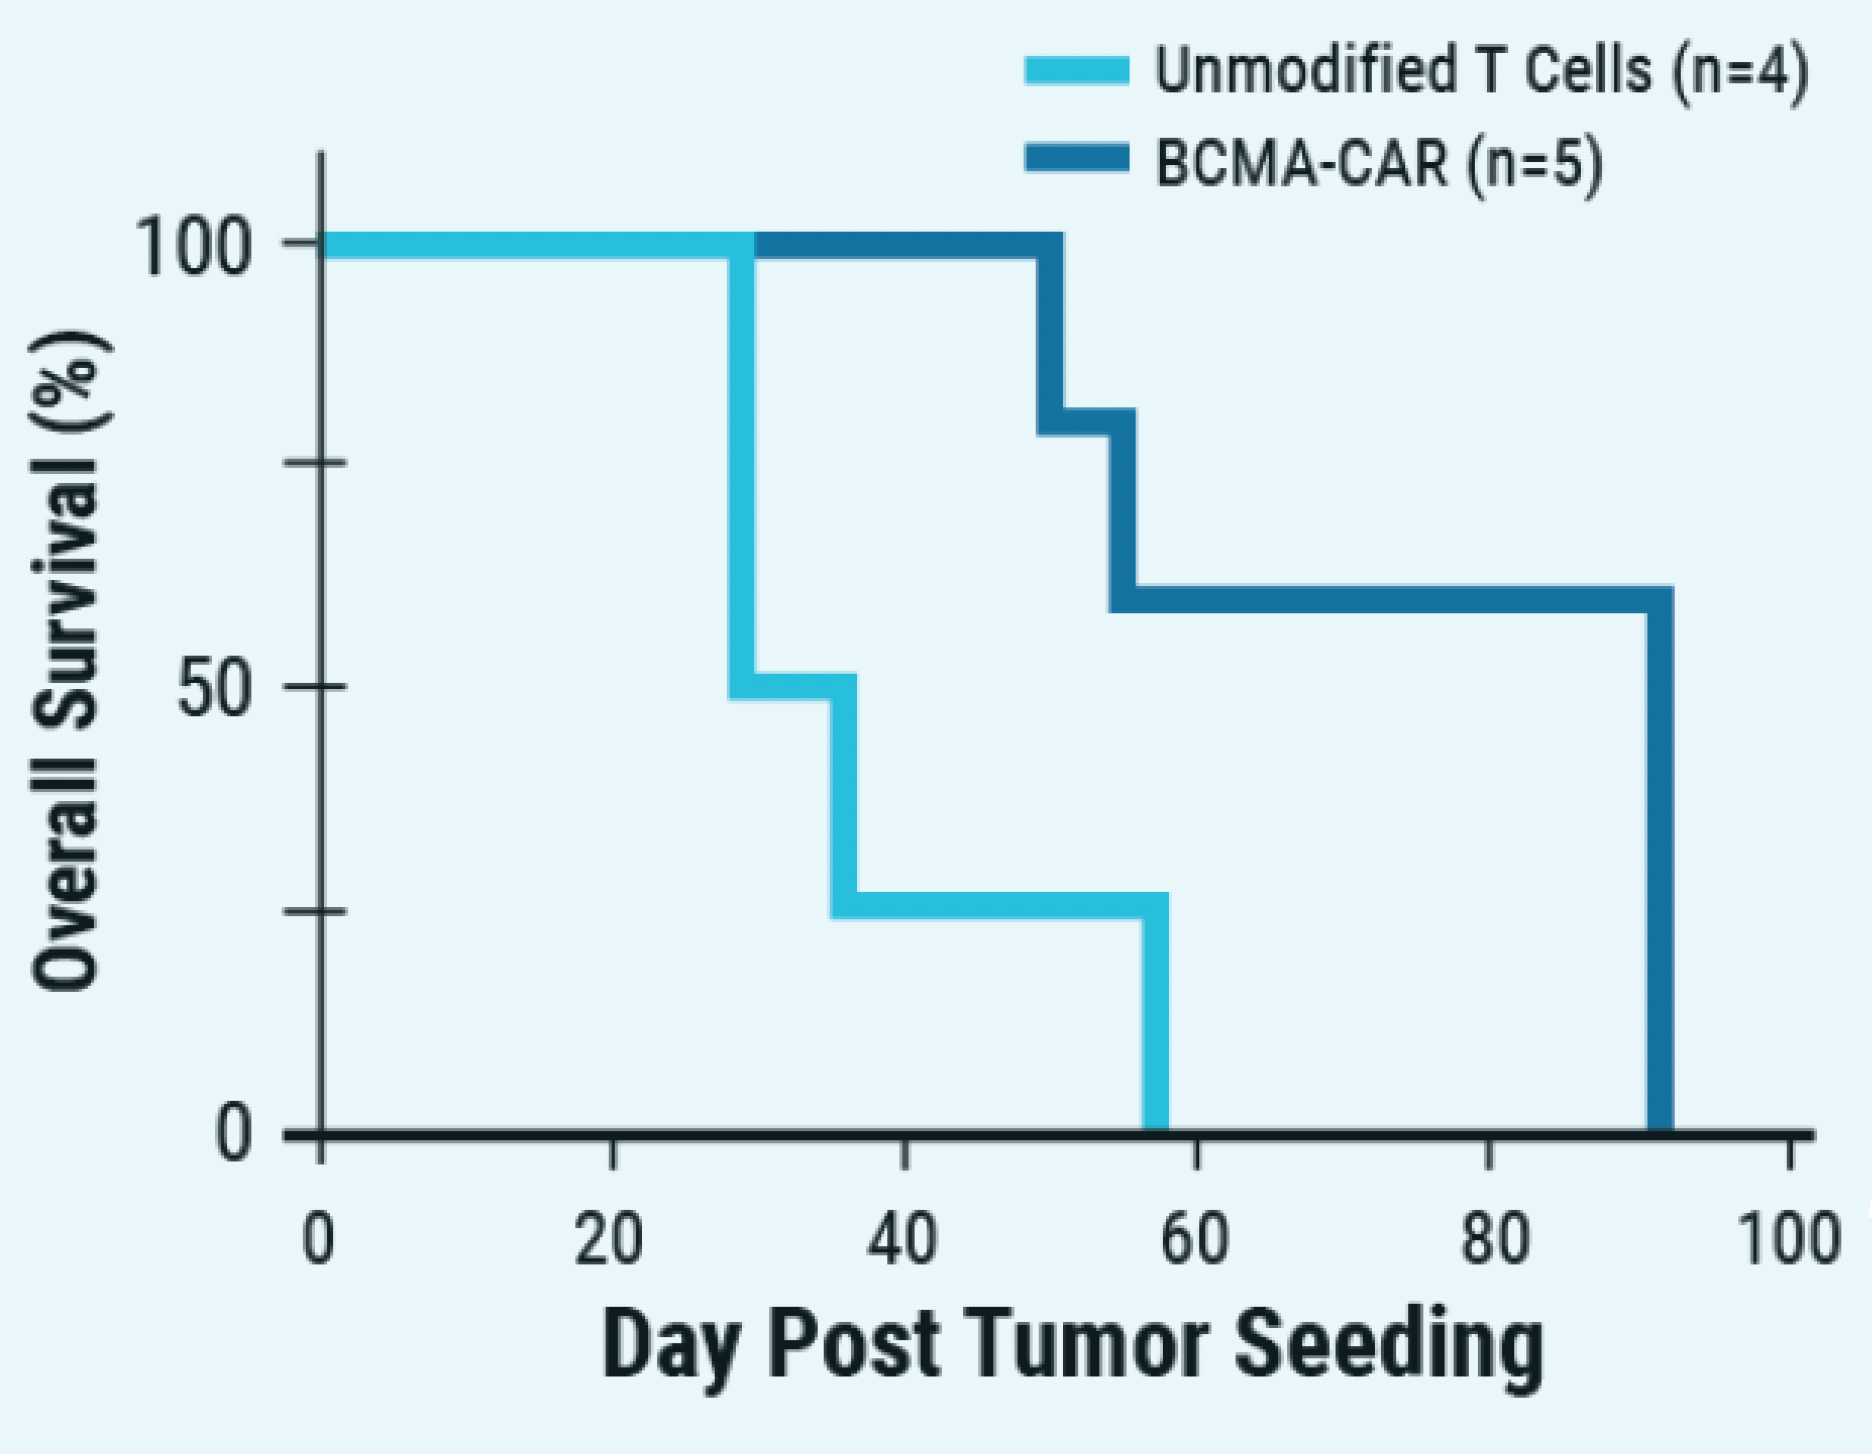
Step graph of overall survival of tumor-bearing mice by percent over day post tumor seeding up to 100 days. Two lines: light blue represents unmodified T cells (n=4) and dark blue represents BCMA-CAR (n=5). Survival reached zero before day 60 for unmodified T cells and at about day 90 when treated with engineered CAR T cells (both from same donor). Survival rate also remained at 100 percent up until about day 60 for those treated with engineered CAR T cells.

Figure 5: A) ExPERT GTx® electroporation was used to deliver CRISPR RNP + ssCTS template to the TRAC locus of activated T cells. B) KI efficiencies of BCMA-CAR on day seven and 10; Ctrl - no inhibitor, M - M3814M DNA-PK inhibitor and MT - M + histone deacetylase class I/II Inhibitor. C) The total number of CAR+ T cells on days seven and 10 of the cGMP manufacturing protocol. Dotted line - estimated patient dose of 1x10⁸ cells. D) Flow plots of BCMA-CAR KI efficiencies for each condition on day 10. E) BCMA-expressing multiple myeloma cell lines were effectively targeted and killed by engineered CAR T cells; Effector: Target, 1:1. F) Overall survival was improved in tumor-bearing mice when treated with engineered CAR T cells or unmodified T cells from the same donor.

This content was adapted from Shy BR., Nat Biotechnol. 2023 Apr;41(4):521-531. doi: 10.1038/s41587-022-01418-8. PMID: 36008610.

MaxCyte electroporation of dsDNA HDRT enables efficient knockout/knockin in human T cells

A) Workflow with ExPERT GTx

Illustration of GTx electroporation workflow, starting with a human figure and IV bag to represent primary human T cell isolation. From there, a cluster of blue cells indicates T cell activation and electroporation with a more tightly-packed blue cluster: two concentrations of a CD19- CAR-CTS HDRT. Followed is an image of the GTx processing assembly and instrument, which leads to T cell expansion visualized by another blue cell cluster. Finally, an illustration of a cytometer for measuring test results.

B) Cell viability over time

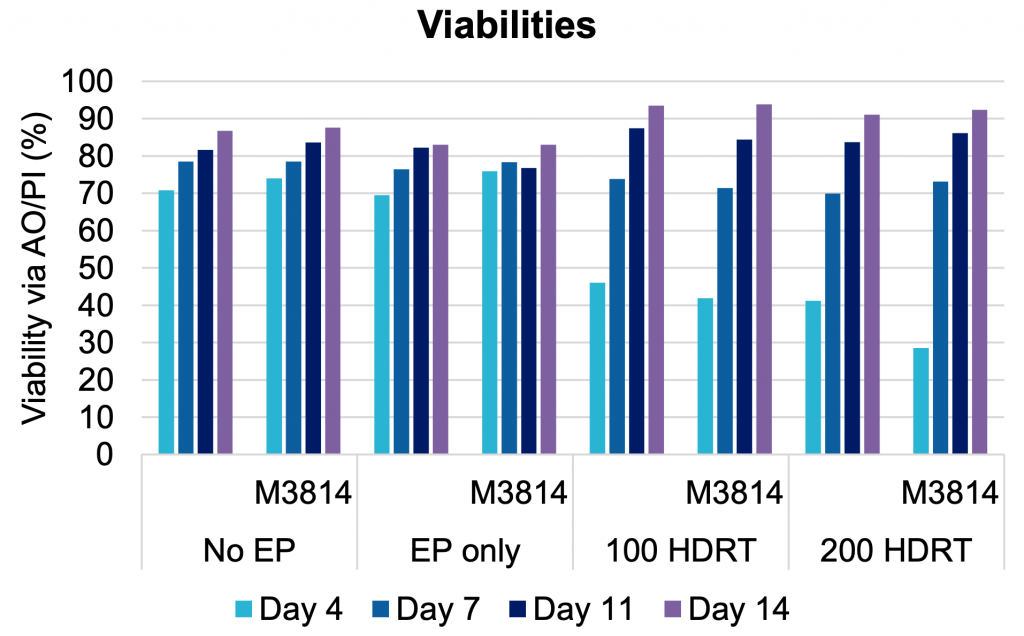
Bar graph of cell viability by percent (identified via acridine orange (AO) and propidium iodide (PI) stain) over four electroporation (EP) conditions — none, just EP, and EP with two concentrations of a CD19- CAR-CTS HDRT, 100 and 200. Four bars represent days of testing: day 4 is light blue, day 7 is dark blue, day 11 is navy, and day 4 is purple. Cell viability remained high (mostly between 70 and 90%) from day seven to day 14 in all conditions tested. Also noted on y axis: cells were also cultured with M3814 enhancer, with no effect on viability or TRAC efficiency.

C) TRAC knockout efficiencies over time
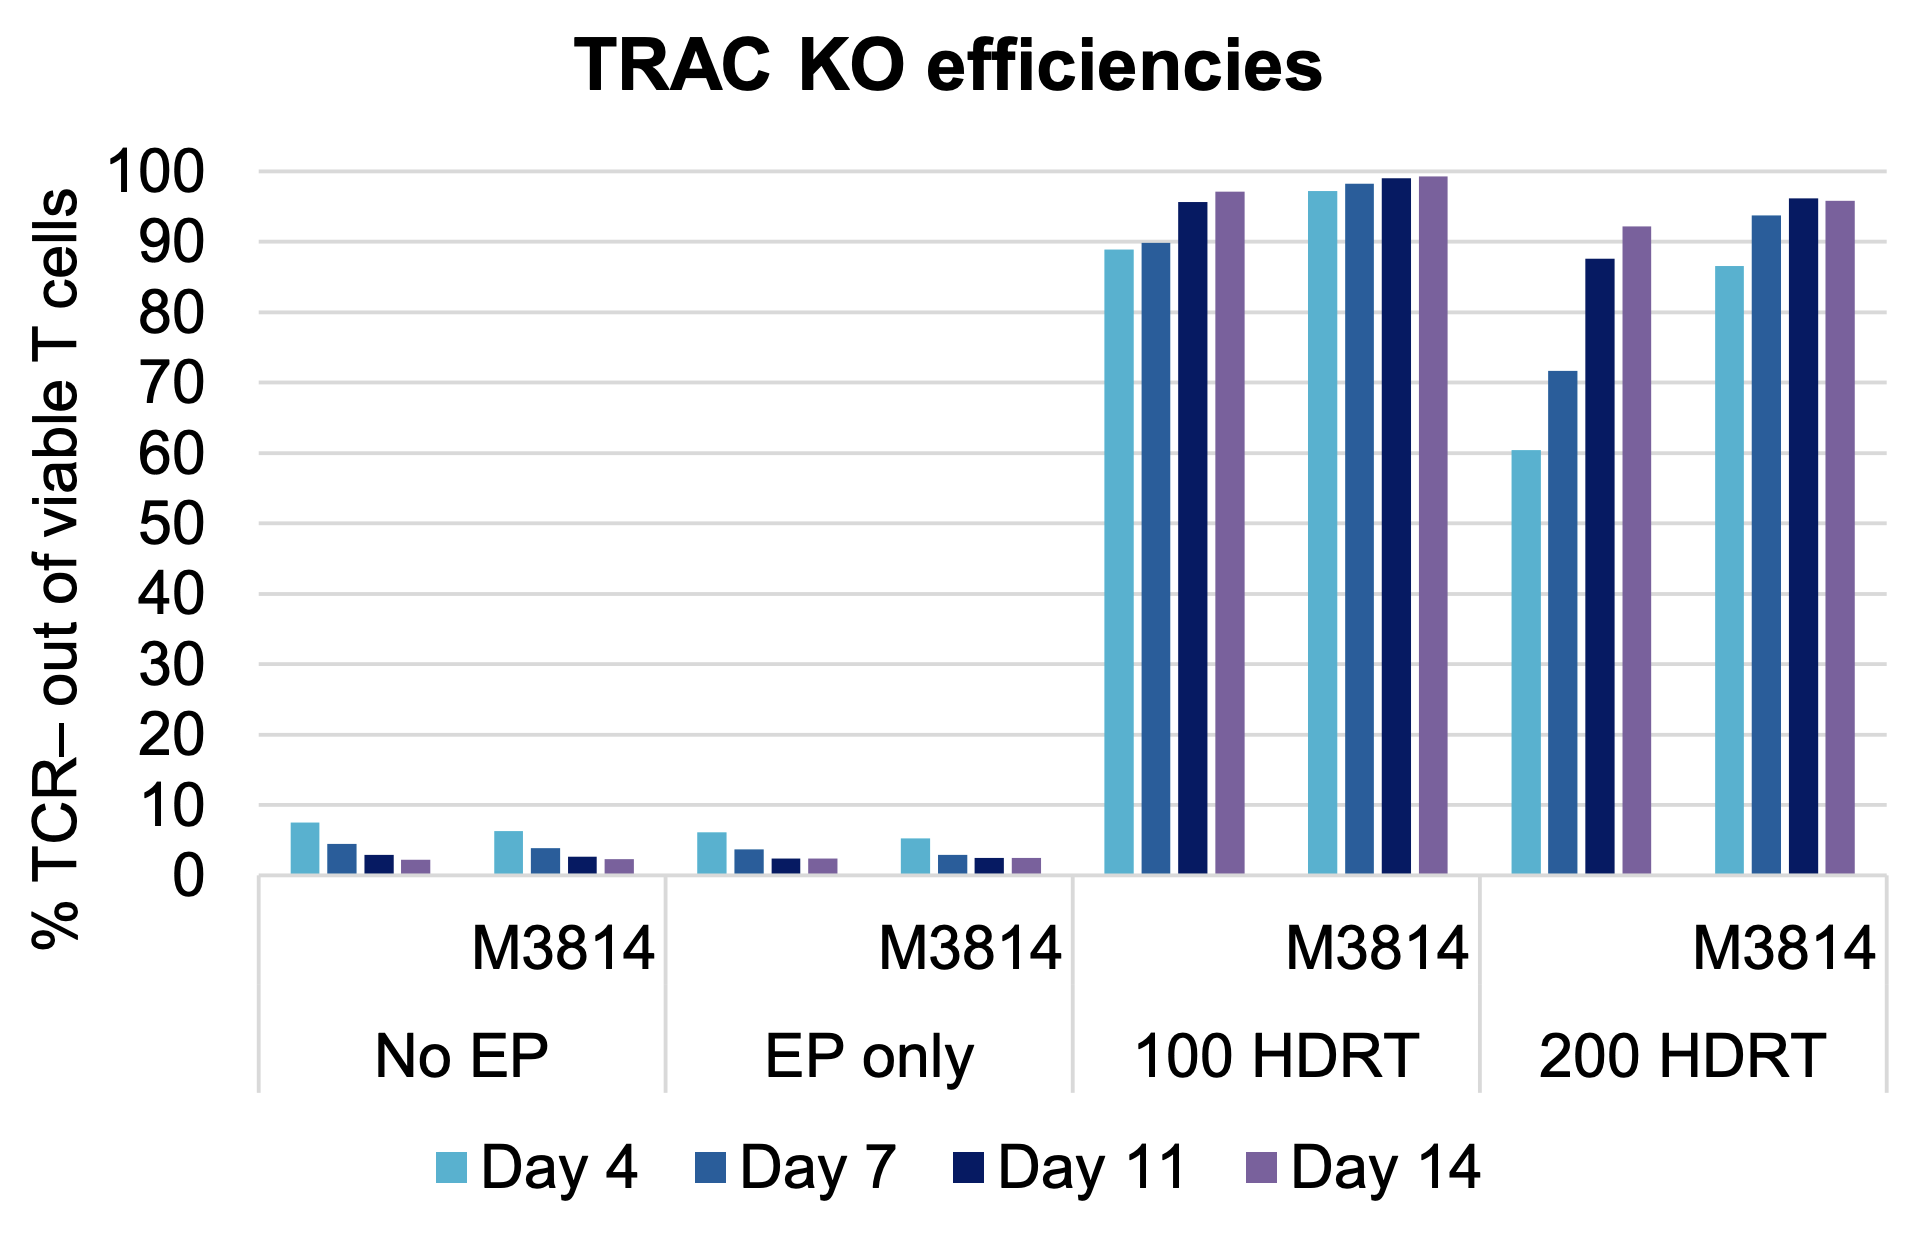
Bar graph of TCR percent out of viable T cells over four electroporation (EP) conditions — none, just EP, and EP with two concentrations of a CD19- CAR-CTS HDRT, 100 and 200. Four bars represent days of testing: day 4 is light blue, day 7 is dark blue, day 11 is navy, and day 4 is purple. Compared to no or only EP, TRAC knockout much higher (between 60 and 100 percent) with 100 and 200 HDRT. Also noted on y axis: cells were also cultured with M3814 enhancer, with no effect on viability or TRAC efficiency.

D) CAR knockin efficiencies over time

TCR-CAR+ percent out of viable T cells over four electroporation (EP) conditions — none, just EP, and EP with two concentrations of a CD19- CAR-CTS HDRT, 100 and 200. Compared to no or only EP, CAR knockin much higher (between 15 and 80 percent) with 100 and 200 HDRT (zero for no EP and just EP). Also noted on y axis: cells were also cultured with M3814 enhancer, with no effect on viability or TRAC efficiency.

Figure 6: A) Activated primary human T cells were electroporated with CRISPR RNP targeting the TRAC locus and two concentrations of a CD19- CAR-CTS HDRT in an OC-25x3 (3x25 mL) processing assembly. After resting, electroporated cells were cultured for 20 hours in media with or without M3814 enhancer (1 µM). Following a media change, cells were expanded for 14 days. (B) Cell viability, (C) TRAC knockout efficiency and (D) CAR knockin were measured periodically. Cell viability remained high from day seven to day 14 in all conditions tested. The addition of M3814 had no impact on cell viability or TRAC efficiency. Optimal CAR knockin was seen in the presence of enhancer.

Related resources

CRISPR RNP and ssDNA Co-Electroporation in Activated T Cells for Efficient CAR Knock-In A
Poster
High Efficiency Gene Editing of Hard-to-Transfect Primary Cells with MaxCyte Electroporation and Synthego sgRNAs
Blue title slide for presentation "Highly Efficient Engineering of Difficult-to-Transfect Immune Cells Using MaxCyte Electroporation" by Ashley Strickland-Dietz, PhD.
Presentation
Case Studies: MaxCyte Electroporation Engineers Difficult-to-Transfect Immune Cells
View all resources