Poster
Optimizing Transposon-Based Gene Delivery for Cell Therapy Applications with the MaxCyte® ExPERT Scalable Electroporation Platform
Abstract
Transposons are an efficient and proven method of gene transfer and have a wide range of applications from cell line engineering to generation of autologous cell therapies. Transposon systems, like piggyBac, can support insertion of large DNA templates and achieve seamless editing with minimal disruptions to genomic integrity. Compared to gene delivery using viral vectors, transposons are more cost-effective and present fewer manufacturing complexities. Transposons are transfected into cells in the form of plasmids or linear dsDNA and the corresponding transposase enzyme is co-transfected as plasmid, mRNA or protein. Electroporation is a primary ex vivo method for delivering transposons due to its ability to load large cargoes with minimal impact on cell health and functionality.
In this study we sought to optimize the delivery of the piggyBac (PB) transposon system for engineering of cell lines and primary T cells using MaxCyte’s GMP-compliant ExPERT GTx® platform with a specific focus on maximizing transposition efficiency, cell expansion, recovery and functionality while limiting vector copy number.
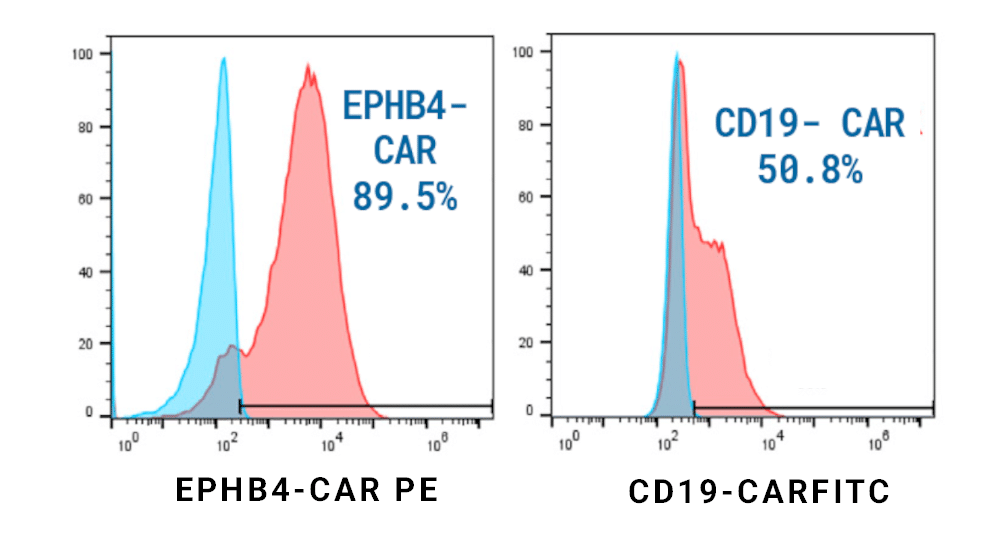
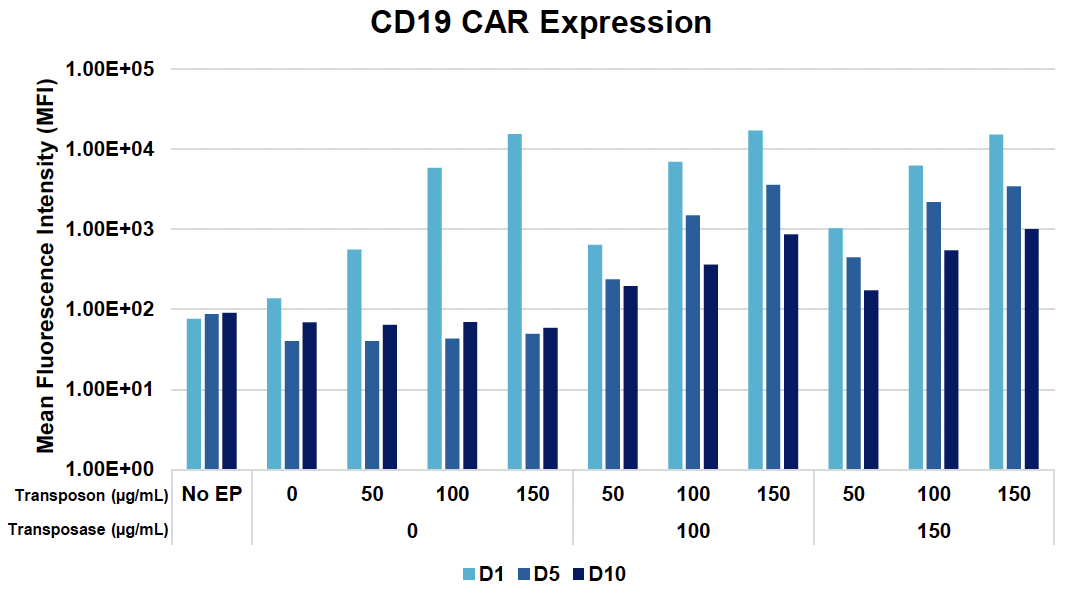
We first generated a PB transposon plasmid encoding a reporter gene (GFP) to study the relative effects of loading agent concentrations, electroporation parameters and other variables on transgene expression and integration efficiency. We initially electroporated K562 cells with a range of concentrations of PB GFP transposon plasmid and PB transposase mRNA to test different ratios and total quantities of transposon and transposase. Following expansion, a GFP expression of over 97% by flow cytometry was achieved at day 17 post electroporation. Vector copy number (VCN), normalized to human albumin copies when analyzed by QIAcuity dPCR, varied in accordance with the relative amounts of transposon plasmid and transposase mRNA that were transfected. We also generated a PB Nanoplasmid transposon encoding a second-generation anti-CD19 BB-z CAR and co-electroporated it with PB transposase mRNA into primary activated T cells—we achieved over 50% CD19 CAR transposition efficiency by day five post EP. As with GFP, CD19 CAR expression and VCN correlated with the relative transposon and transposase concentrations in the electroporation reaction.
These results support previously published data showing how MaxCyte can enable efficient delivery of transposons with minimal impact on cell health for CD19 CAR T cell manufacturing workflows.
Optimizing piggyBac GFP transposon and transposase integration in K562 cells
A) Workflow for engineering K562 cell line with plasmid transposon and mRNA hyPBase using the MaxCyte ExPERT platform

B) Cell viability and counts during 17-day expansion

C) GFP expression and Mean Fluorescence Intensity (MFI) during expansion

D) Workflow for copy number analysis

E) Copy numbers of plasmid backbone, backbone to ITR junction, GFP transgene plus human albumin (hALB) and vector copy number (VCN)
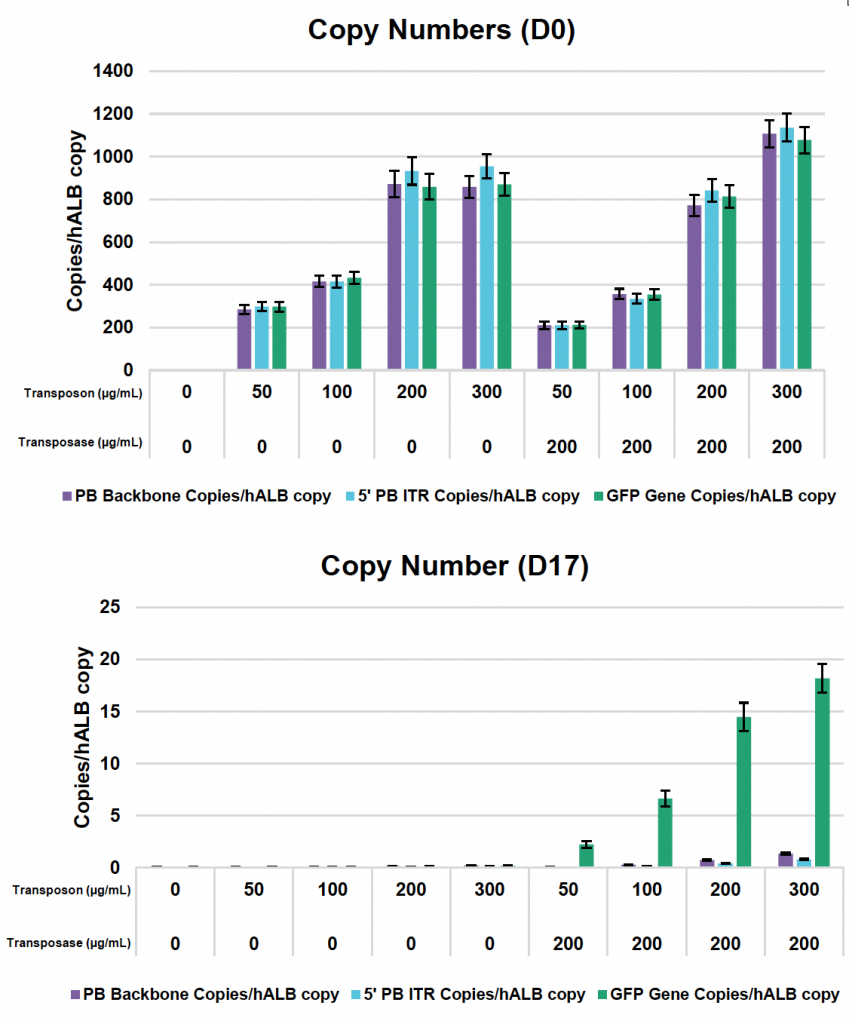

Figure 1: A) K562 cell line was expanded and electroporated (EP) with the concentrations of loading agents shown in the table. Cells were processed with MaxCyte OC-100x2 processing assemblies (PAs) using the K562 EP protocol. B) Cells were maintained for a 17-day expansion period where viability and counts were monitored. C) GFP expression and Mean Fluorescence Intensity (MFI) of live cells were evaluated by flow cytometry. D) Samples were collected immediately after EP (day 0) and at the end of the expansion (day 17), and genomic DNA was extracted and subjected to a restriction digest with XmnI to both linearize the plasmid and fragment the genomic DNA for downstream analysis by dPCR. E) Primers targeting the GFP transgene, plasmid backbone and backbone to ITR junction, as well as primers specific to human albumin (hALB) [1], were used to determine absolute copy numbers of each. Copies of ITR junction were subtracted from GFP gene copies to calculate integrated transposon copy numbers, also referred to as vector copy number (VCN).
Evaluating CD19 CAR expression using piggyBac Nanoplasmid transposon in activated T cells
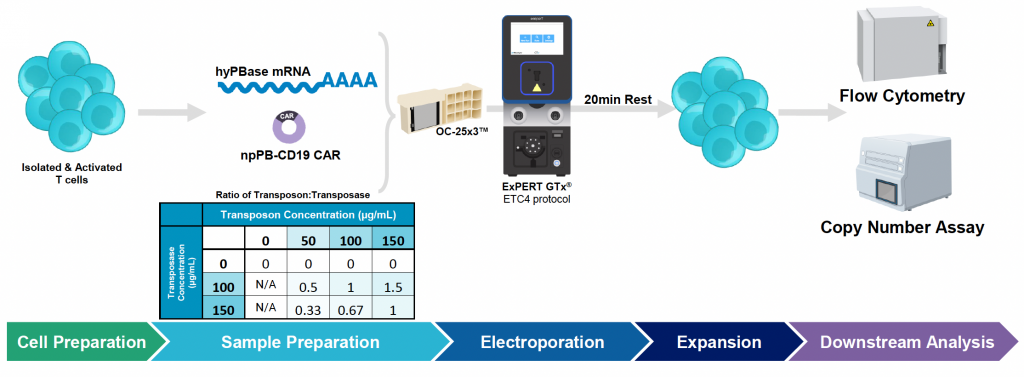
A) Workflow for engineering activated T cells with PB anti-CD19 BB-z CAR Nanoplasmid transposon and hyPBase mRNA using the MaxCyte ExPERT GTx
B) CD19 CAR transfection efficiency and expression during 10-day expansion

C) Cell viability and counts during expansion

D) Workflow for copy number analysis

E) Copy numbers of anti-CD19 CAR transposon insert and backbone to ITR junction plus human albumin (hALB) and vector copy number (VCN)
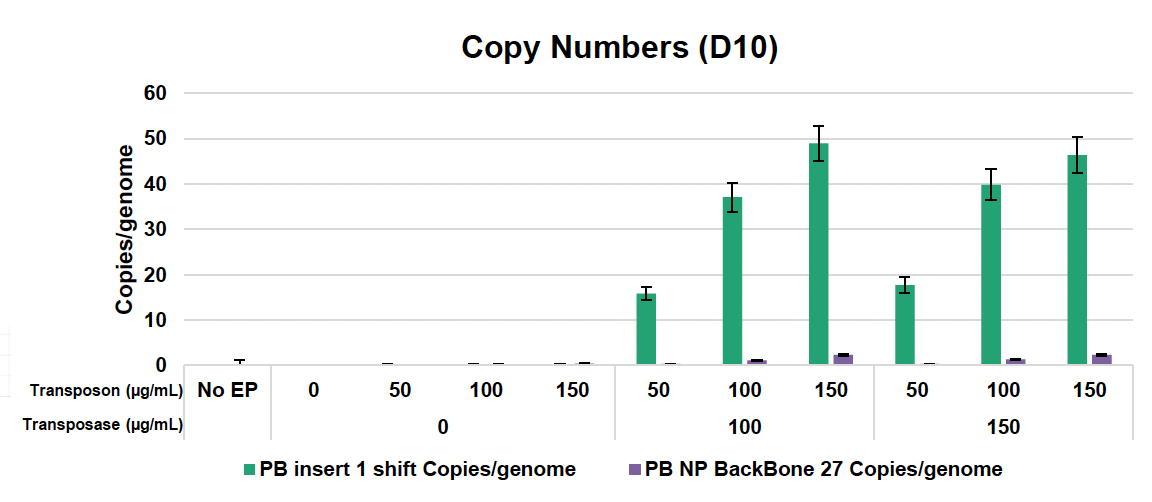

Figure 2: A) Activated T cells were electroporated with the concentrations of loading agents, shown in table above, using the OC-25x3 processing assembly (PA) with the “Expanded T Cell 4” EP protocol. B) Cells were expanded for 10 days; anti-CD19 CAR expression and MFI were measured by flow cytometry at D1, D5 and D10 post EP. C) Viability and cell counts were monitored by hemocytometer. D) Samples were collected at the final timepoint (D10), and genomic DNA was extracted. The genomic DNA was then subjected to a restriction digest with DpnI to clear excess unintegrated plasmid and PvuII was added to the PCR reaction to fragment genomic DNA. E) Primers targeting the anti-CD19 CAR transposon insert and backbone to ITR junction, as well as primers specific to the human albumin (hALB) gene, were used to determine absolute copy numbers of each target. Copies of backbone to ITR junction and anti-CD19 CAR insert were normalized to genome copies (hALB copies/2) and subtracted to calculate VCN.
Maximizing CD19 CAR T cell yield using high transposon to transposase ratios
A) General workflow for engineering activated T cells with PB anti-CD19 BB-z CAR Nanoplasmid transposon and mRNA hyPBase using the MaxCyte ExPERT GTx

B) CD19 CAR transfection efficiency and expression during nine-day expansion

C) Cell viability and counts during expansion
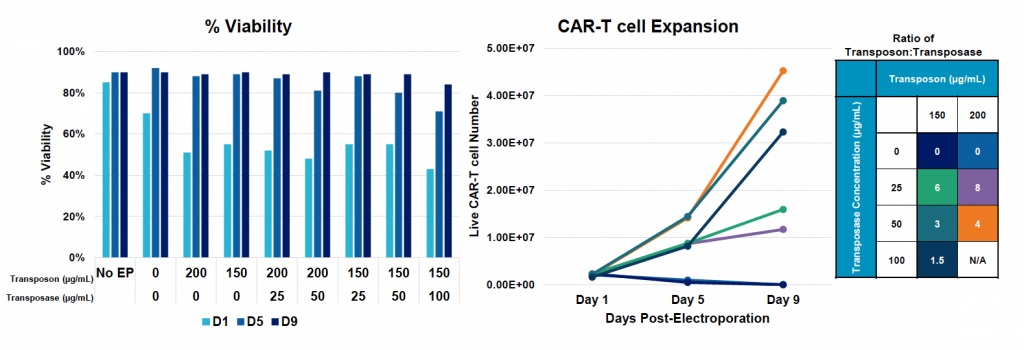
D) Vector copy number (VCN)

Figure 3: A) General workflow for engineering activated T cells with PB anti-CD19 BB-z CAR Nanoplasmid transposon and mRNA hyPBase using the MaxCyte ExPERT platform. Activated T cells were electroporated with the concentrations of loading agents, shown in table above, using the OC-100x2 processing assembly (PA) and “Expanded T Cell 4” EP protocol. B) Cells were expanded for nine days, where anti-CD19 CAR expression and MFI were measured by flow cytometry. C) Viability and cell counts were monitored by hemocytometer. D) Samples were collected at the final timepoint (day 9), and genomic DNA was extracted and subjected to a restriction digest with DpnI. The same primers and enzymes were used for dPCR as in Figure 2. Copies of ITR junction and CD19 CAR insert were normalized to genome copies (hALB copies/2) and used to calculate VCN, as previously described.
Confirming transposon and transposase loading conditions in multiple donors and characterizing the CD19 CAR T cell drug product
A) Workflow for multi-donor engineering of activated T cells
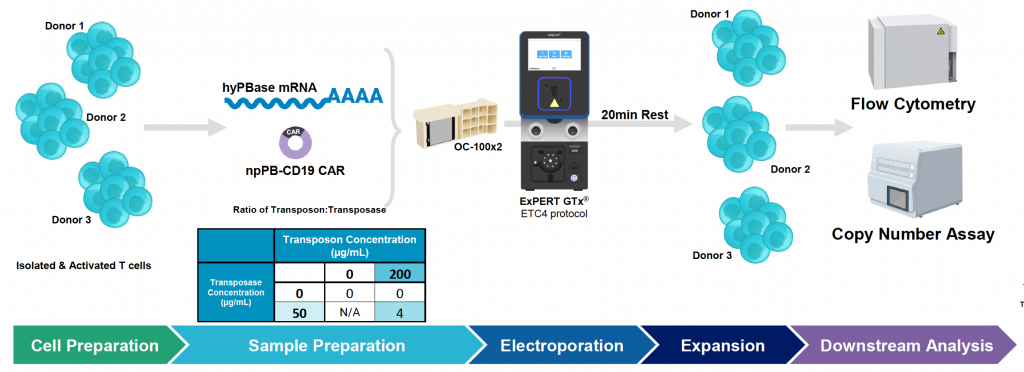
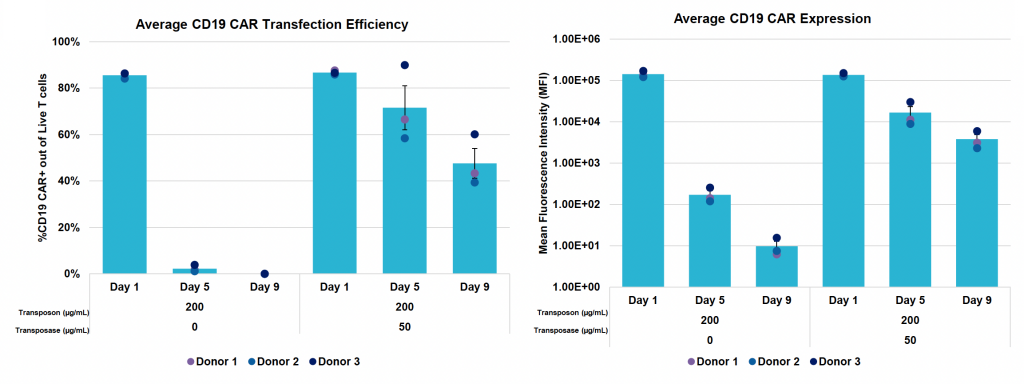
B) Average CD19 CAR transfection efficiency and expression during nine-day expansion
C) Cell viability and counts during expansion

D) Vector copy number (VCN)

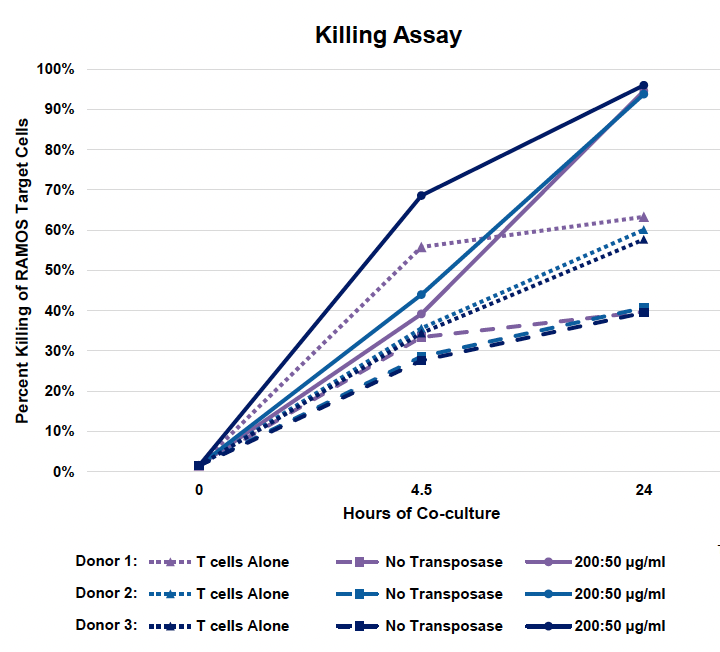
E) Cytotoxicity of CD19 CAR-T cells
F) Phenotypic analysis

Figure 4: A) Activated T cells from three donors were processed and engineered as previously described. Cells were expanded for nine days post EP and B) CD19 CAR transfection efficiency and expression were measured by flow cytometry and C) counted via hemocytometer at D1, D5 and D9 post EP. D) Samples were collected at the final timepoint (day 9), genomic DNA was extracted, dPCR was performed and VCN was calculated as previously described. E) Cytotoxicity of CD19 CAR T cells was measured by co-culturing with Ramos cells for 24 hours at an effector-to-target ratio of 2:1. F) Phenotypic analysis was performed by flow cytometry to differentiate CD4 and CD8 expression and further classify each subset into effector memory (Tem), central memory (Tcm), naïve (Tn) or effector memory RA (Temra).
Summary
MaxCyte® electroporation efficiently engineers primary human T cells with piggyBac transposons to express CARs, while maintaining high cell viabilities, cell yields and functionality.
- GFP transfection efficiency and VCN increased with transposon concentration, while durability of expression increased with transposase concentration in K562 cells.
- CD19 CAR transfection efficiency and VCN increased with transposon concentration, while CAR T cell yield generally increased with higher transposon:transposase ratios.
- The 4:1 transposon:transposase ratio produced the highest CAR T cell yield by balancing transposition efficiency, expression durability and expansion.
- The optimal transposon to transposase condition produced similar CD19 CAR expression, viability, yield, functional killing, phenotype and VCN between multiple donors.
Reference
- van der Velden, V., Cazzaniga, G., Schrauder, A. et al. Analysis of minimal residual disease by Ig/TCR gene rearrangements: guidelines for interpretation of real-time quantitative PCR data. Leukemia 21, 604–611 (2007). https://doi.org/10.1038/sj.leu.2404586
