Poster
Optimizing CRISPR/Cas-Mediated CAR Knockin in Primary Human T Cells Using MaxCyte Electroporation
Abstract
In recent years, chimeric antigen receptor (CAR) T cells have emerged as a leading treatment for various hematological cancers. Despite demonstrating great promise, there are several challenges that limit CAR T cell therapies, including concerns regarding efficacy, safety and manufacturability.
To address these, groups have turned to non-viral engineering of CAR T cells using CRISPR gene editing. In addition to reduced immunogenicity and manufacturing costs, this technology enables precise knockin of tumor-targeting receptors and knockout of genes responsible for rejection, toxicity and immunosuppression. To CRISPR engineer CAR T cells, Cas nucleases, guide RNA (gRNA) and homology-directed repair (HDR) template, DNA must be efficiently delivered into T cells without jeopardizing their viability or functionality.
With this in mind, we sought to generate optimized workflows that enable CRISPR-mediated gene editing in primary human T cells using MaxCyte® electroporation.
To this end, we first identified optimal electroporation protocols and concentrations of sgRNA, Cas9 and HDR template required to knock in GFP at the TRAC locus. Next, we compared different repair template designs, including the addition of Cas9 targeting sequences (CTS). We also investigated multiple HDR template DNA formats, including conventional plasmids and Nanoplasmids™. In addition, we explored the use of small molecule enhancers and identified several that further improved editing efficiencies.
These findings were then used to engineer CD19-targeting CAR T cells. With activated T cells from healthy donors, we could achieve CAR expression levels of greater than 70%. In addition to efficient and reproducible CAR knockin in T cells from multiple donors, cells engineered using this workflow were viable and retained the ability to expand and eradicate CD19-expressing target cells.
Together, these demonstrate the capability of MaxCyte’s clinically validated ExPERT™ electroporation technology to enable non-viral engineering of CAR T cells using the CRISPR/Cas system.
MaxCyte enables non-viral gene knockin in activated T cells
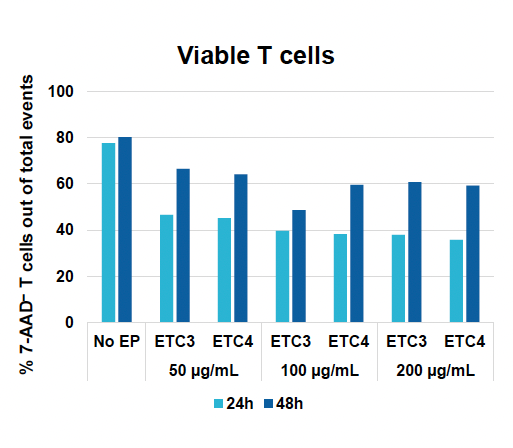
A) Viable T cells at 24 & 48 hours
B) Efficiencies at 24 & 48 hours

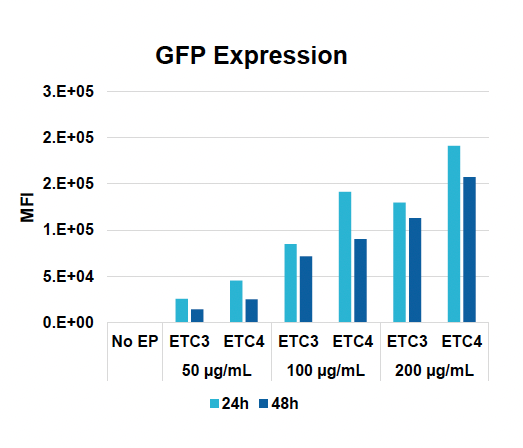
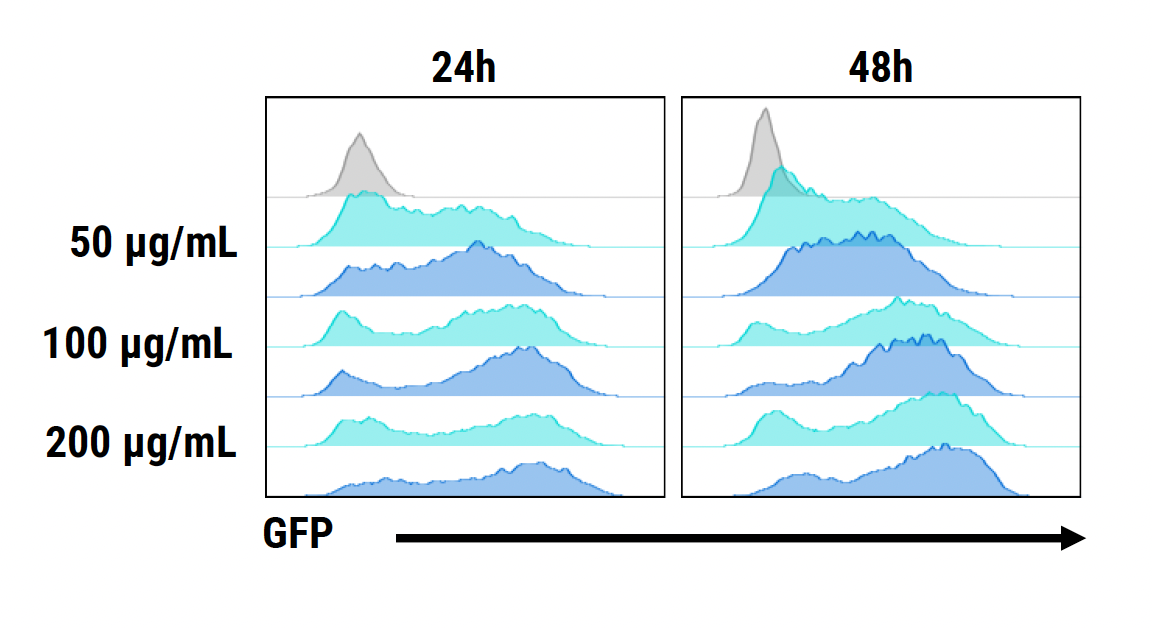
C) GFP expression at 24 & 48 hours
D) GFP expression at 24 & 48 hours
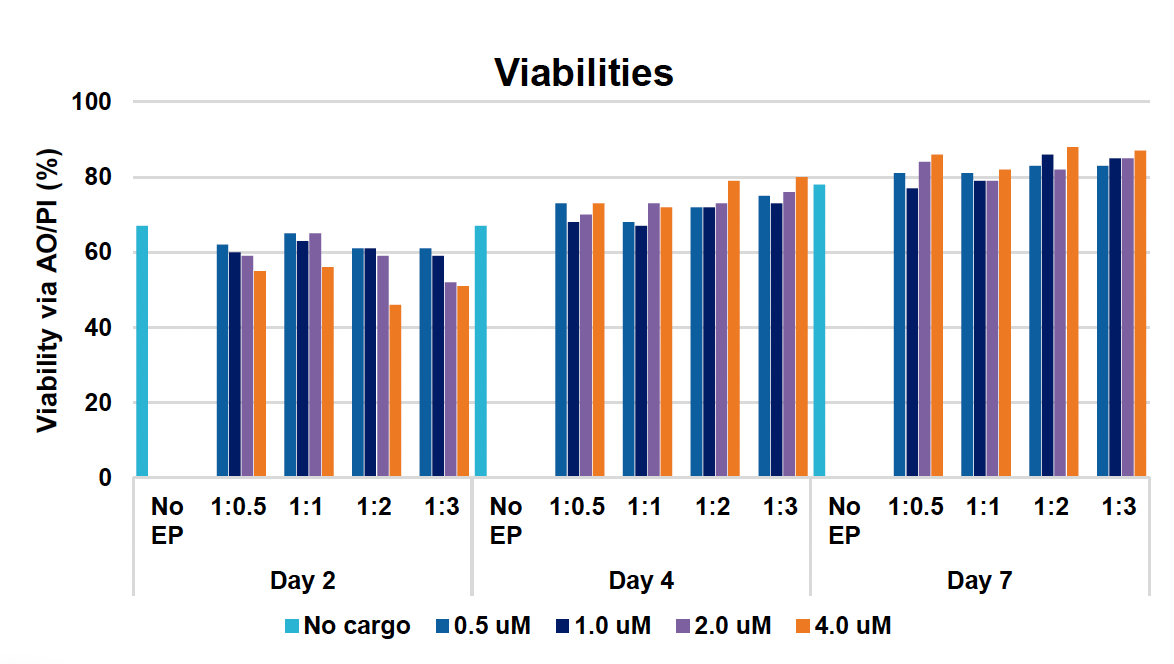
E) Viabilities at days two, four & seven
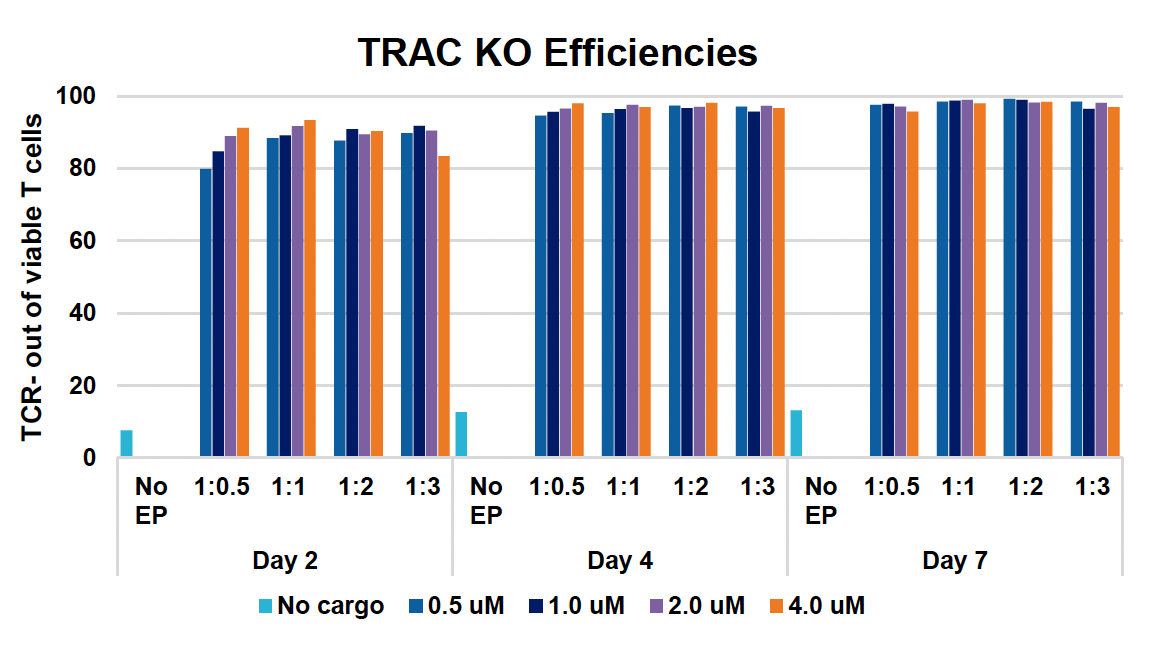
F) TRAC KO efficiencies at days two, four & seven
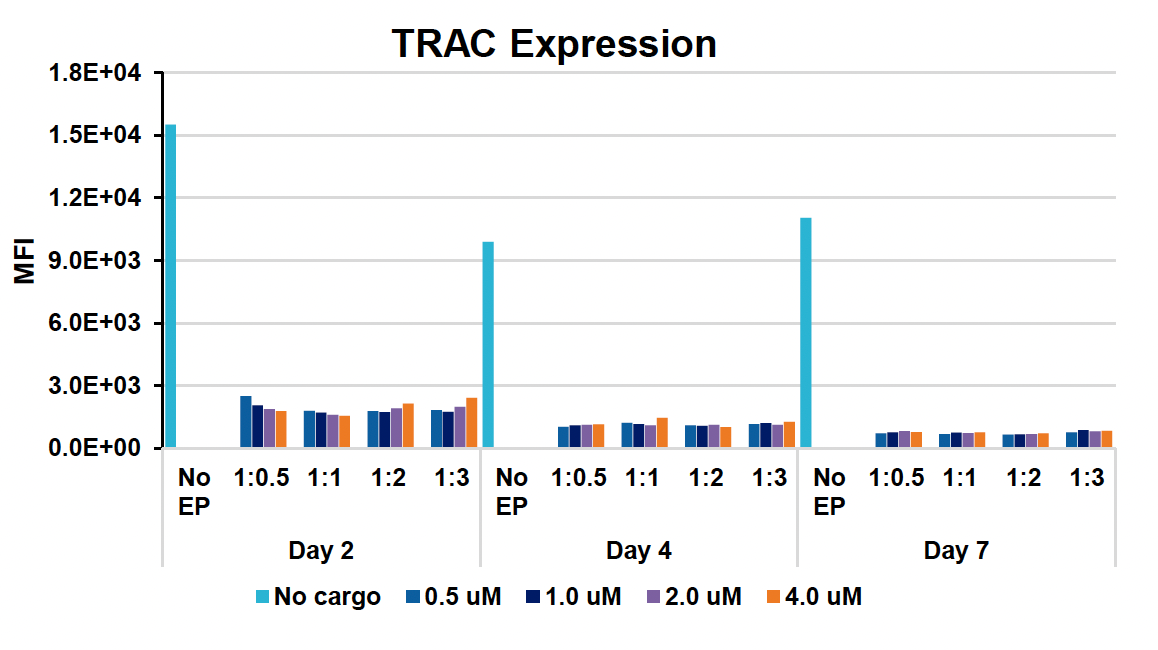
G) TRAC expression at days two, four & seven
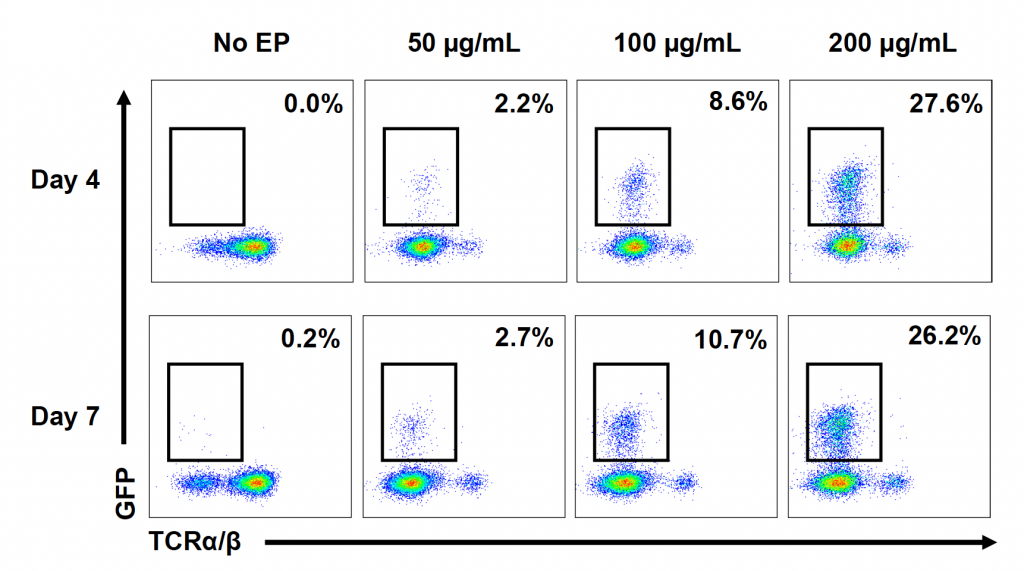
H) TRAC KO & GFP KI at days four & seven
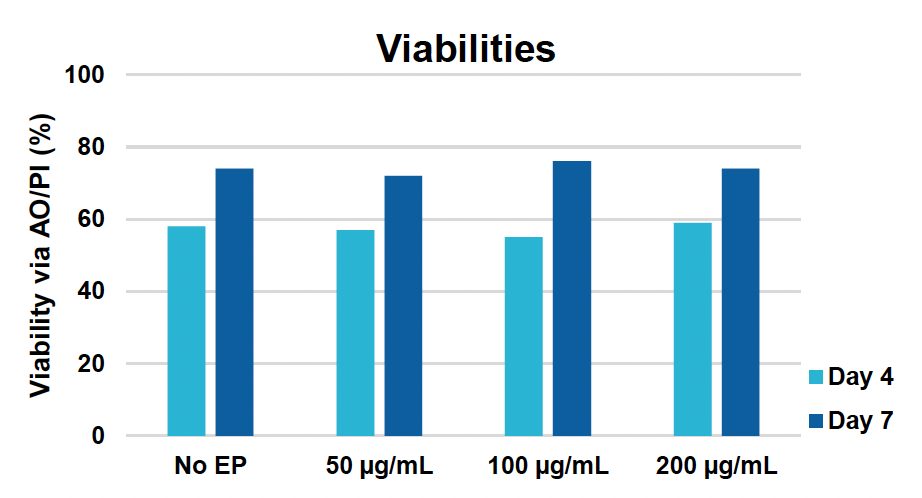
I) Viabilities at days four & seven
J) TRAC KO efficiencies at days four & seven

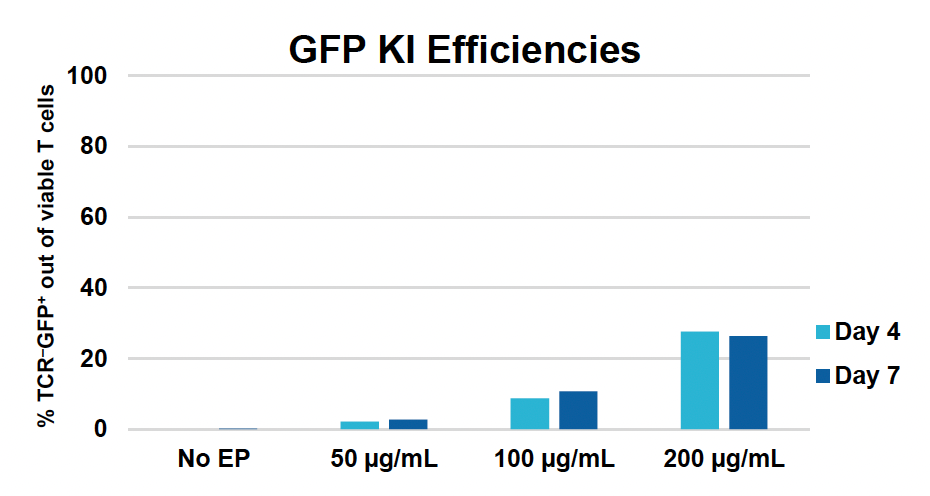
K) GFP KI efficiencies at days four & seven
L) GFP expression at days four & seven
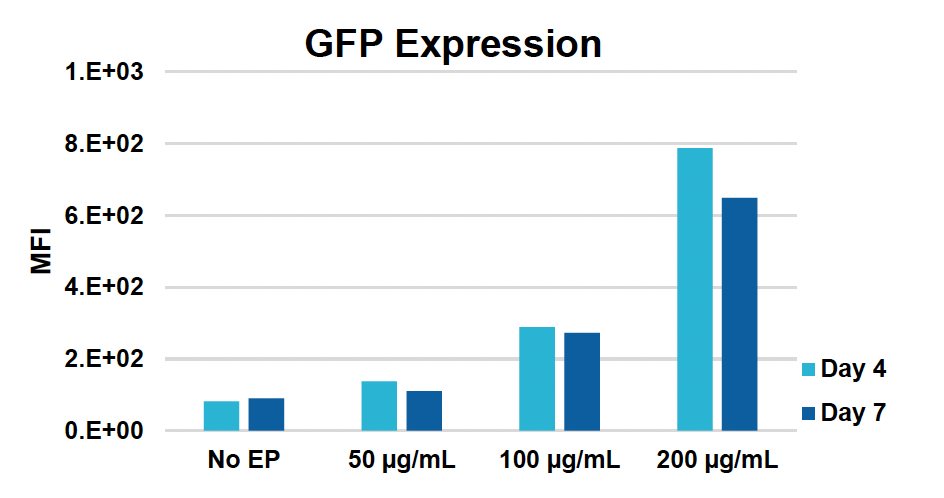
Figure 1: CD3+ T cells were isolated from healthy donors and activated for 48 hours. Activated T cells were transfected with 50, 100 or 200 µg/mL of a GFP-encoding plasmid using the ExPERT GTx® and Expanded T cell 3 (ETC3) or Expanded T cell 4 (ETC4) to determine an appropriate electroporation (EP) protocol for template DNA delivery (A-D). Viable T cells (A), transfection efficiencies (B) and mean fluorescent intensity (MFI) (C, D) were determined by flow cytometry at 24 and 48 hours post EP. To determine conditions for TRAC knockout (KO), varying molar ratios of Cas9 and sgRNA (1:0.5, 1:1, 1:2 and 1:3) were complexed to form ribonucleoproteins (RNP). Activated T cells were then transfected with different final RNP concentrations (0.5, 1.0, 2.0 and 4.0 µm) using ETC4 (E-G). Viabilities (E), TRAC KO efficiencies (F) and TRAC expression (G) were determined using flow cytometry. For GFP knockin (KI), optimal concentrations of HDR template (HDRT) were determined by co-transfecting activated T cells with 0.5 µm of RNP (1 Cas9:2 sgRNA) and either 50, 100 or 200 µg/mL of a plasmid HDRT for GFP KI and viabilities, (I) TRAC KO (H, J), GFP KI (H, K) and GFP expression (L) were measured at day four and day seven post EP.
HDR enhancers, small template DNA and addition of CTS improve knockin
A) GFP KI workflow

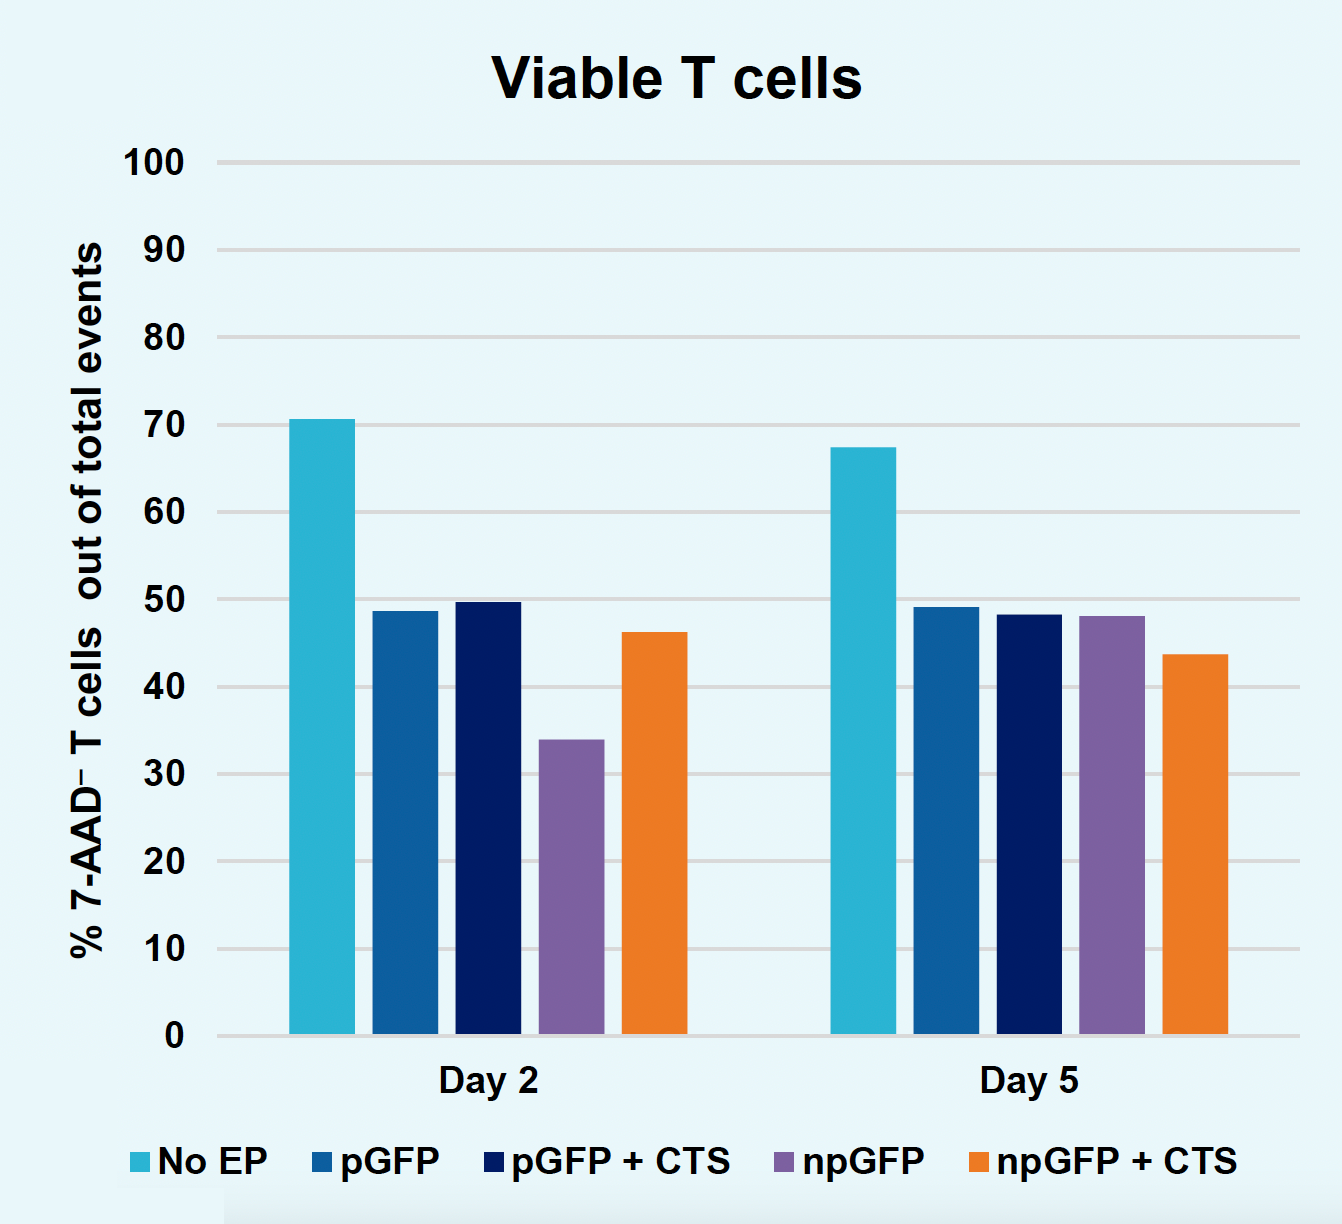
B) Viable T cells at days two & five
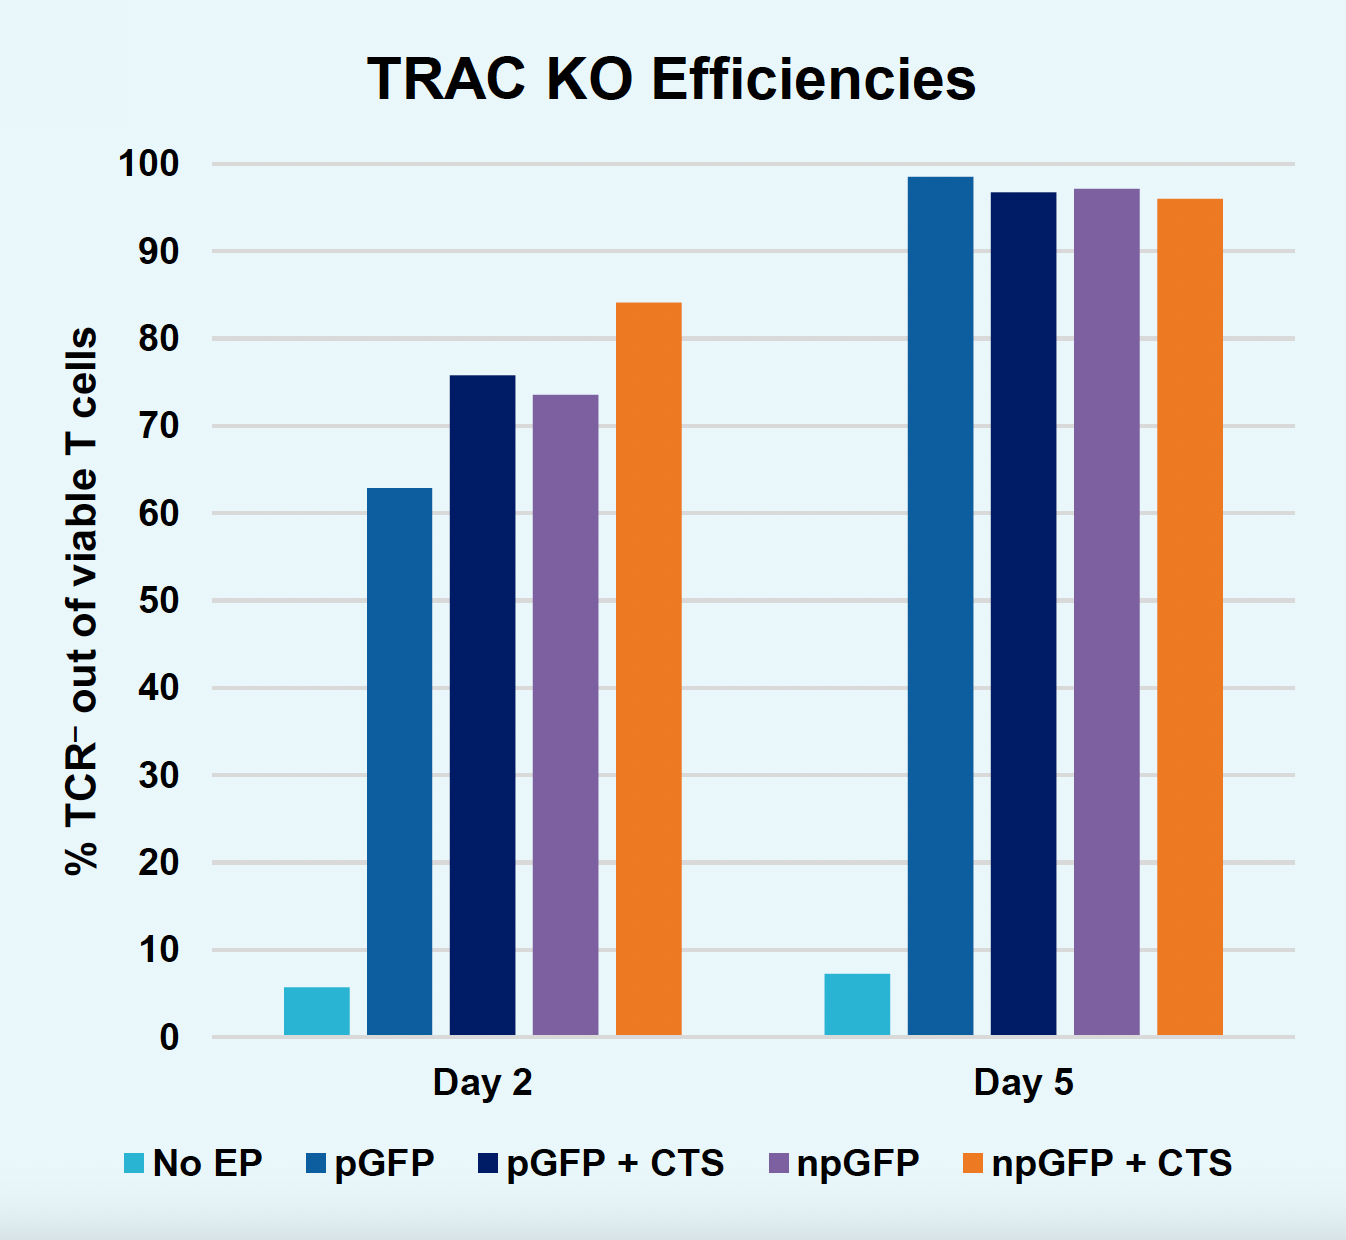
C) TRAC KO efficiencies at days two & five
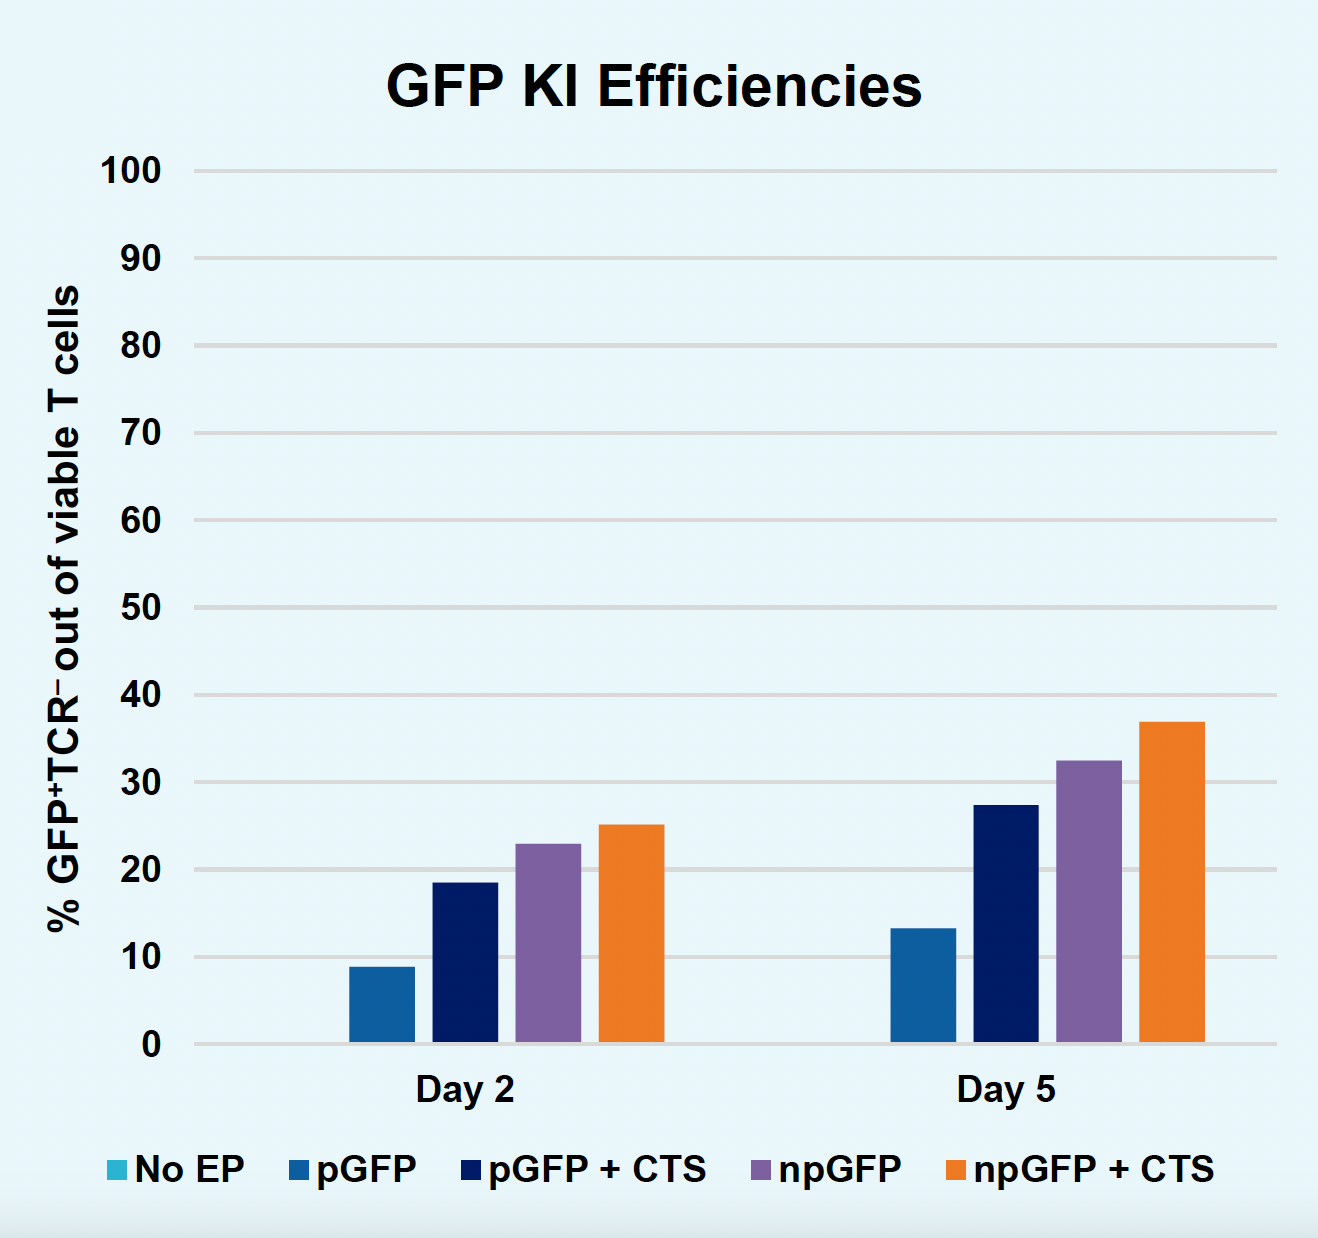
D) GFP KI efficiencies at days two & five
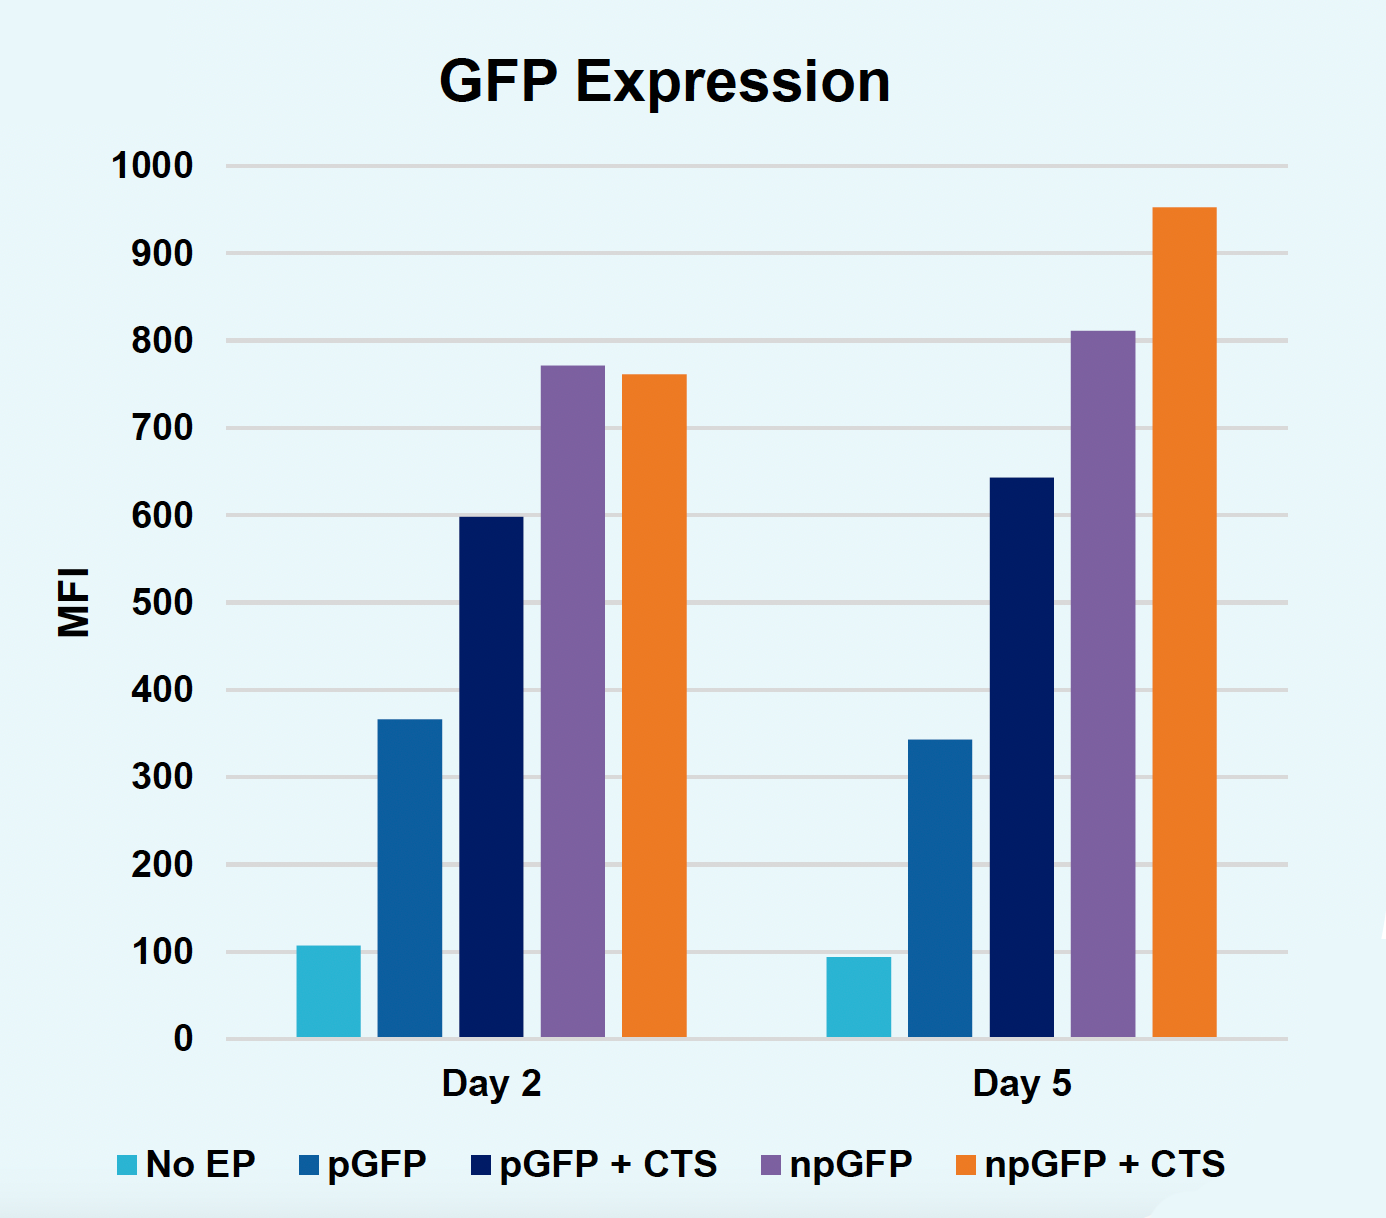
E) GFP expression at days two & five
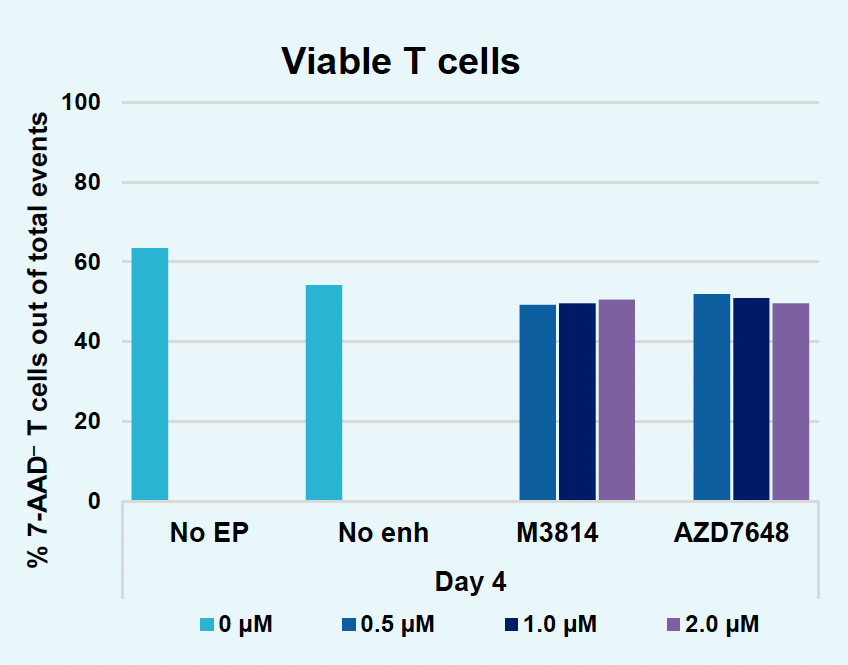
F) Viable T cells at day four
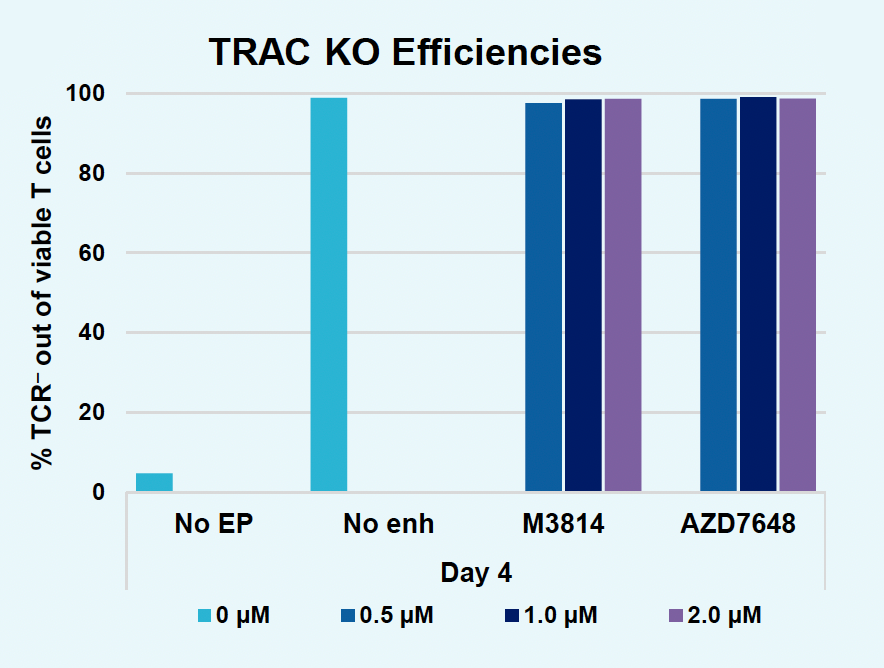
G) TRAC KO efficiencies at day four
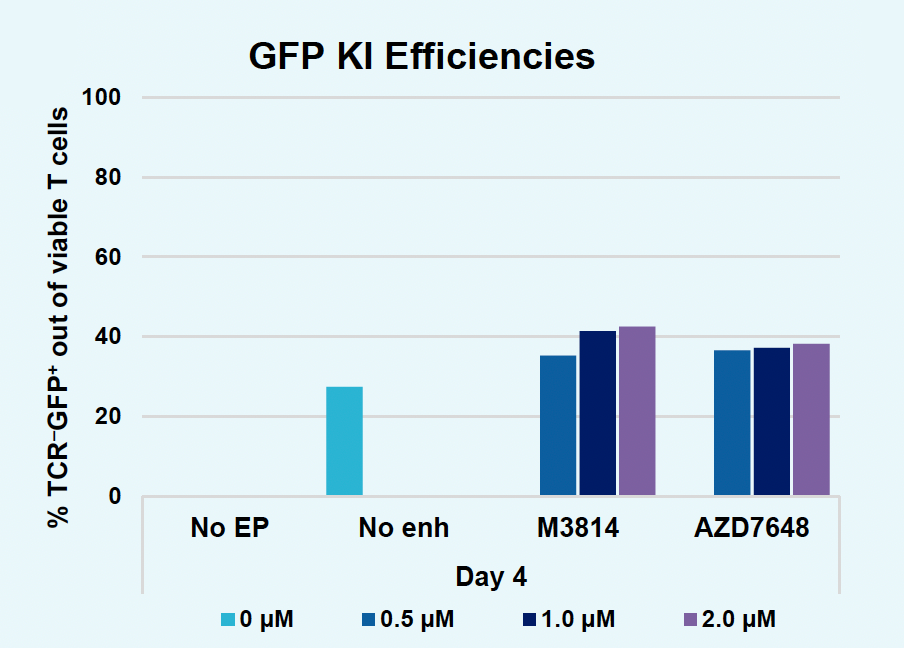
H) GFP KI efficiencies at day four
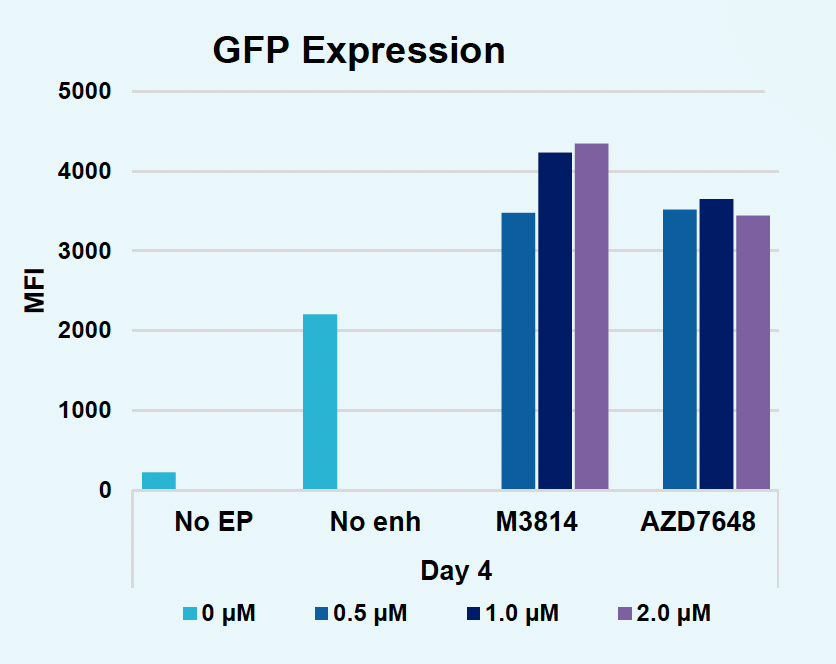
I) GFP expression at day four
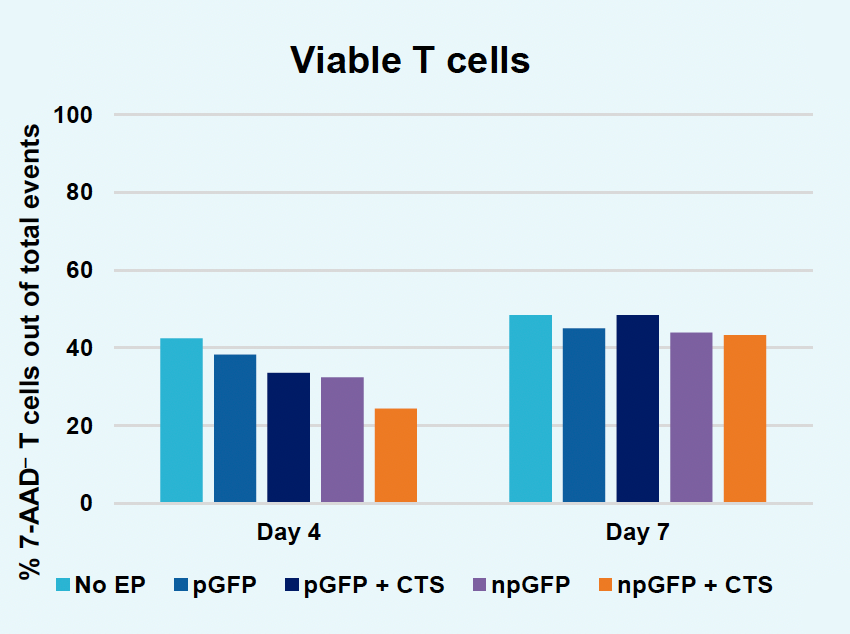
J) Viable T cells at days four & seven
K) TRAC KO efficiencies at days four & seven

L) GFP KI efficiencies at days four & seven

M) GFP expression at days four & seven

N) GFP expression at days four & seven

Figure 2: The workflow for GFP KI established in Figure 1 (A) was further improved. Activated T cells were co-transfected with 0.5 μM or RNP and 200 µg/mL of plasmid (pGFP), plasmid with a Cas9-targeting sequence (CTS) (pGFP + CTS), Nanoplasmid™ (npGFP) or Nanoplasmid with a CTS (npGFP + CTS) HDRT (B-E). Viable T cells (B), TRAC KO (C), GFP KI (D) and MFI (E) were measured at days two and five post EP and demonstrated that smaller HDRTs as well as a CTS improved KI. Similarly, activated T cells were co-transfected with 0.5 μM of RNP and 200 µg/mL of pGFP and samples were split into 7 wells and received either no enhancer of 0.5, 1 or 2 μM of M3814 or AZ7648 (F-I). Viable T cells (F), TRAC KO (G), GFP KI (H) and MFI (I) were measured at day four. Both enhancers improved KI in a dose-dependent manner, but 2 μM M3814 improved KI the most. These two strategies were then combined and found to further enhance GFP KI in activated T cells (J-N).
MaxCyte reproducibly engineers CAR T cells without impacting expansions
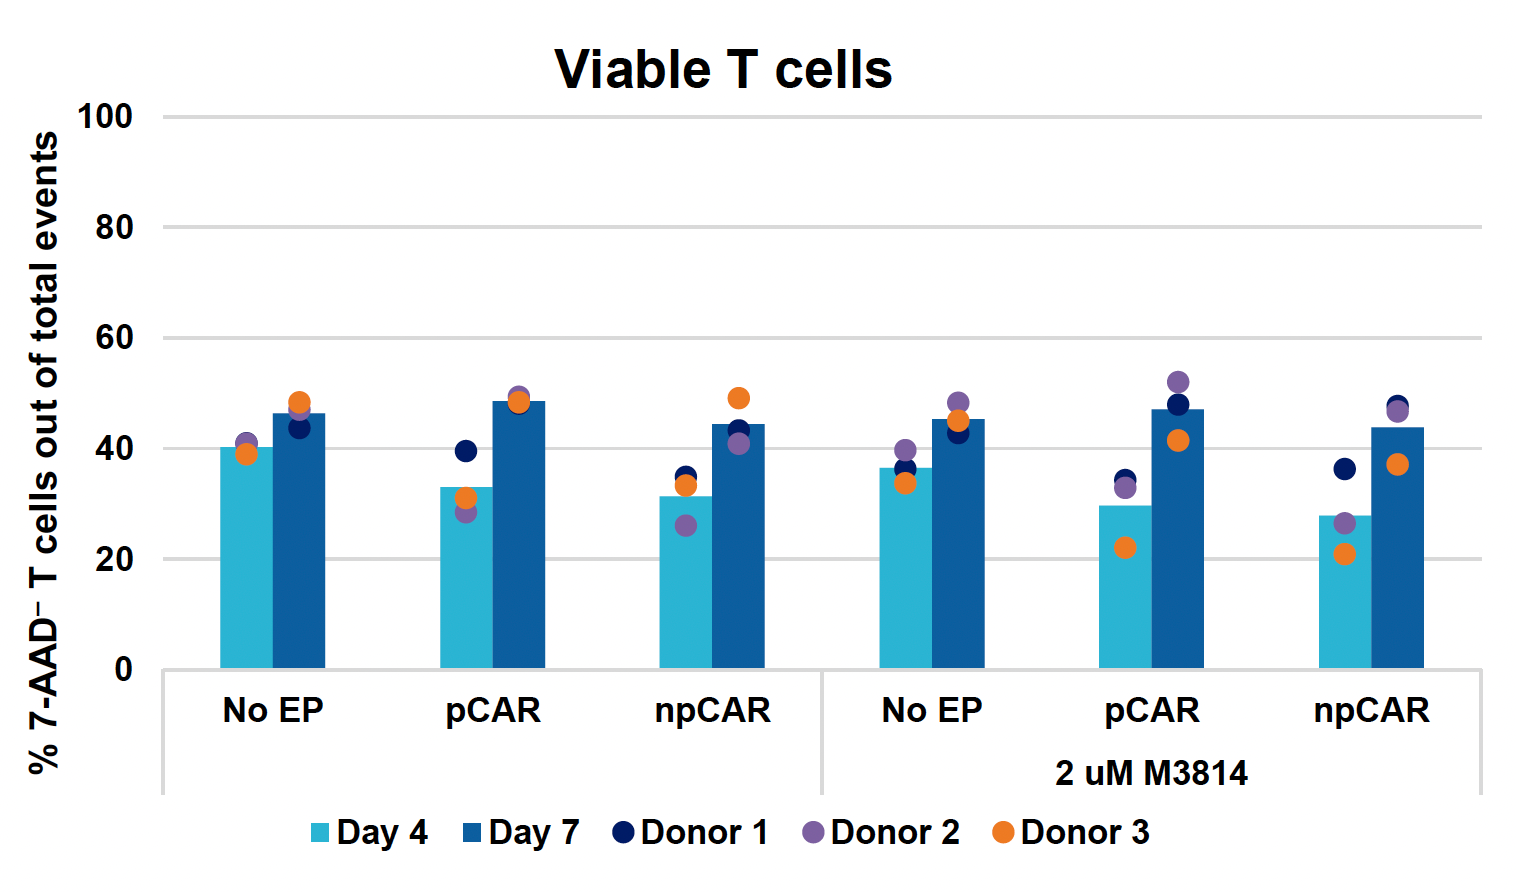
A) Viable T cells at days four & seven
B) TRAC KO efficiencies at days four & seven

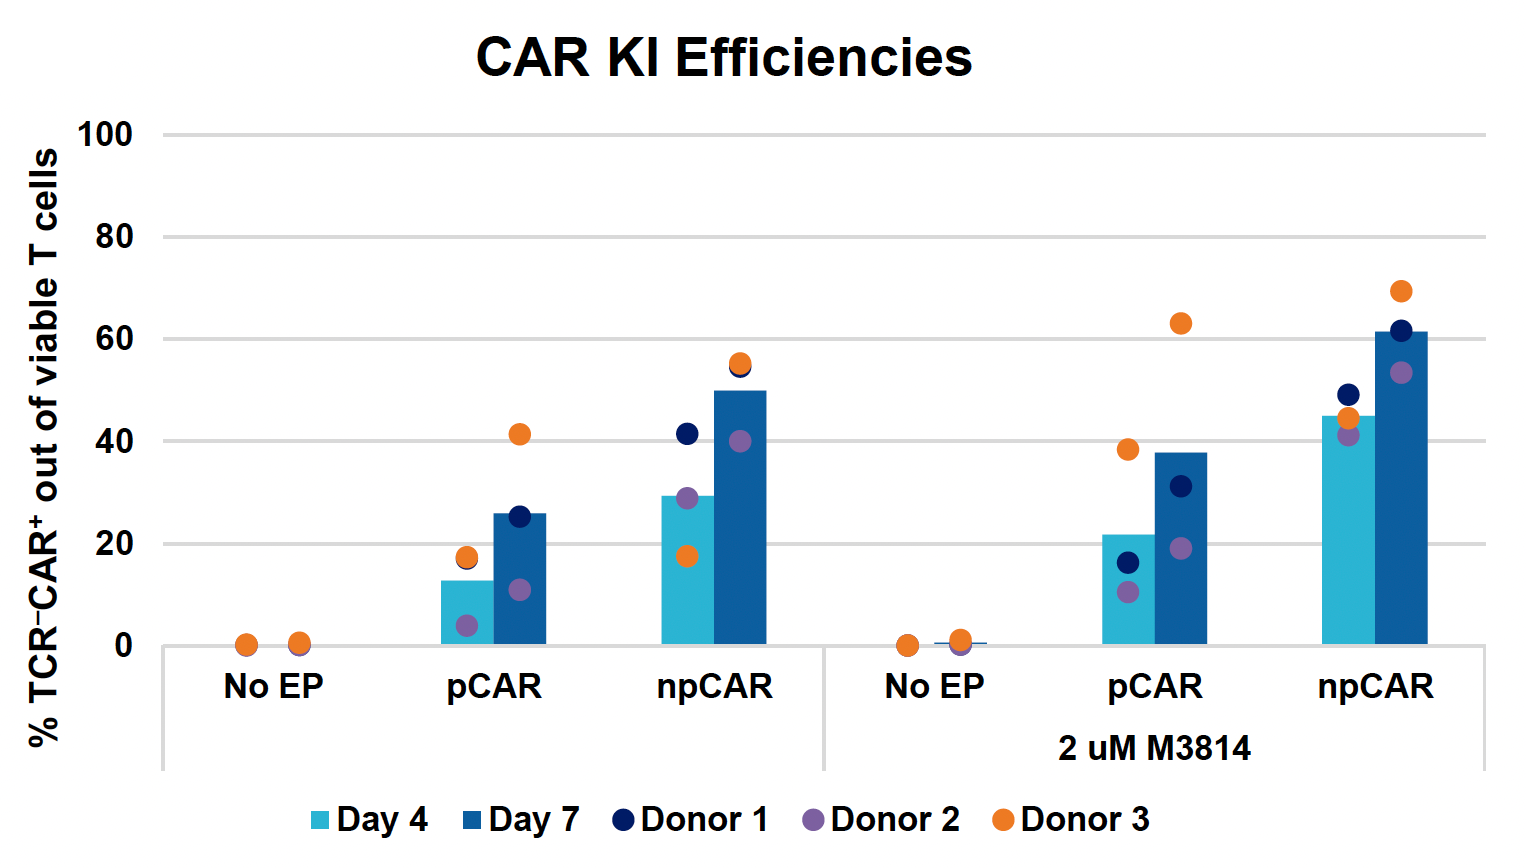
C) CAR KI efficiencies at days four & seven
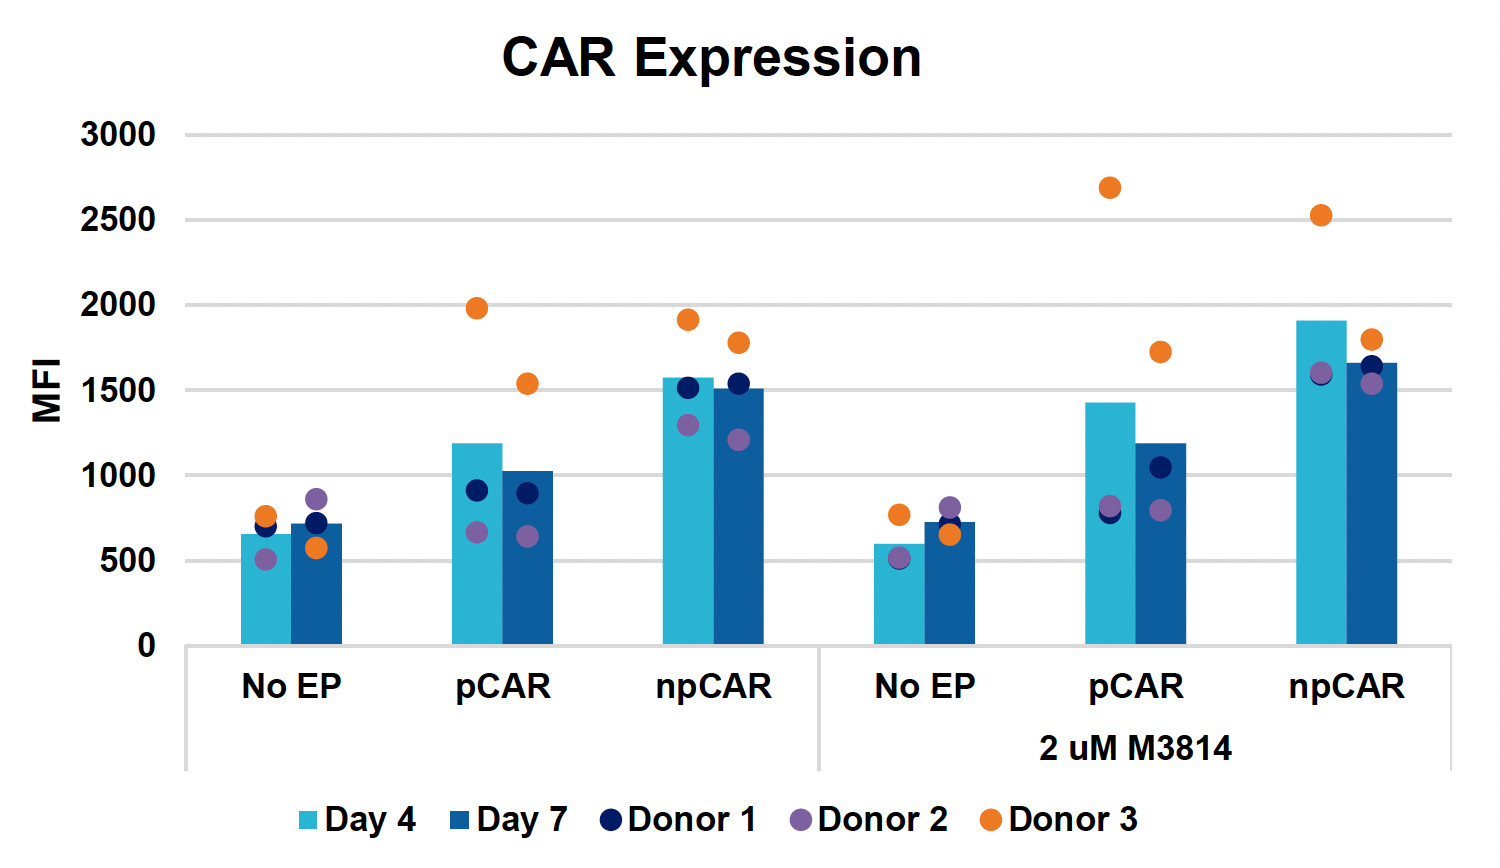
D) CAR expression at days four & seven
E) Viabilities over 14-day expansion
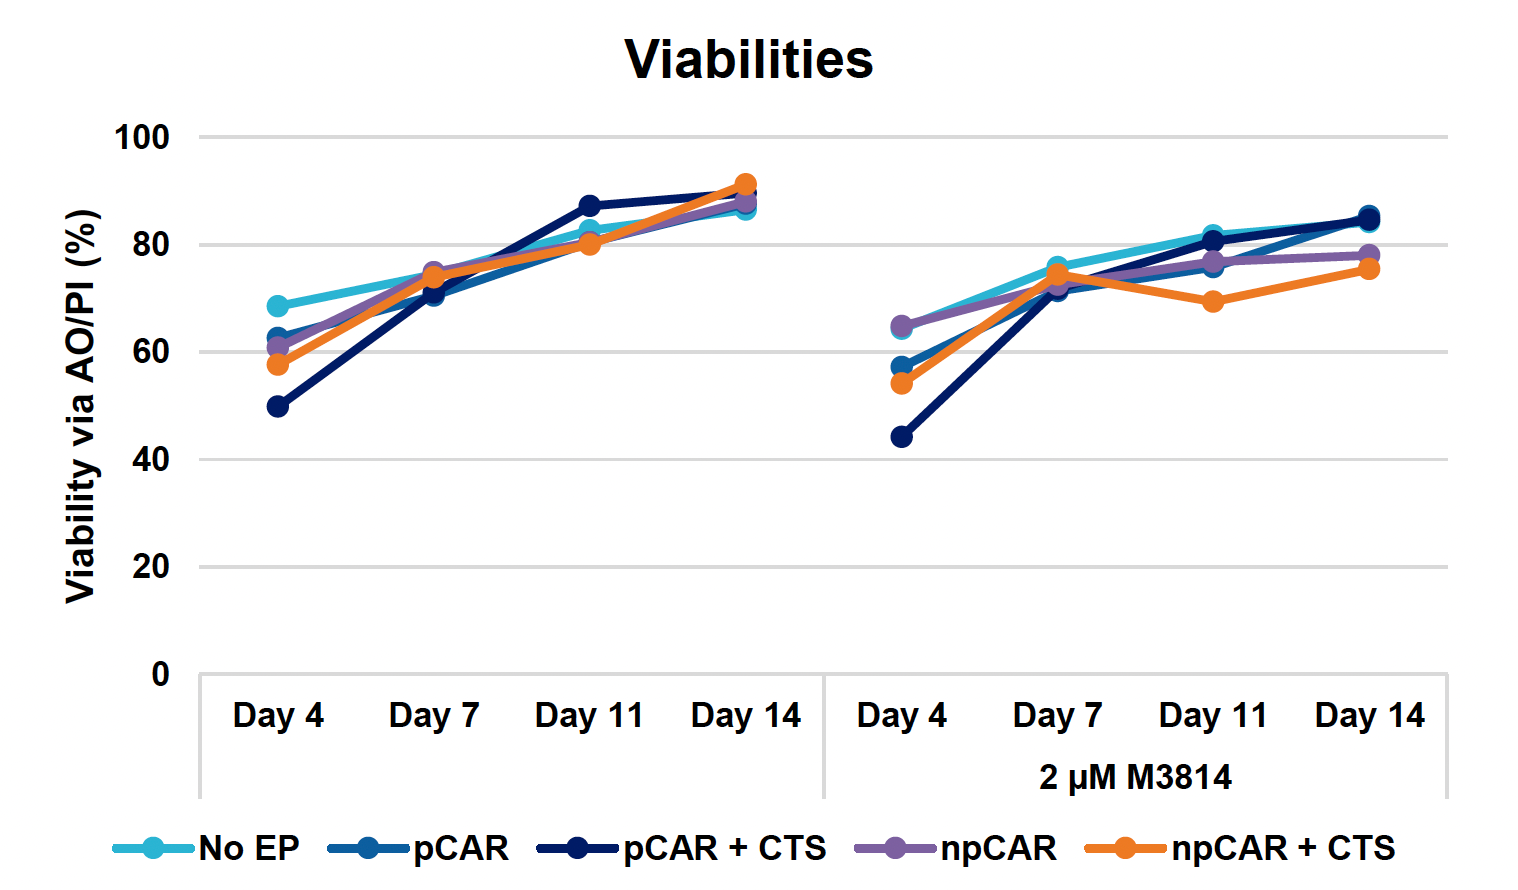
F) Viable cell counts over 14-day expansion
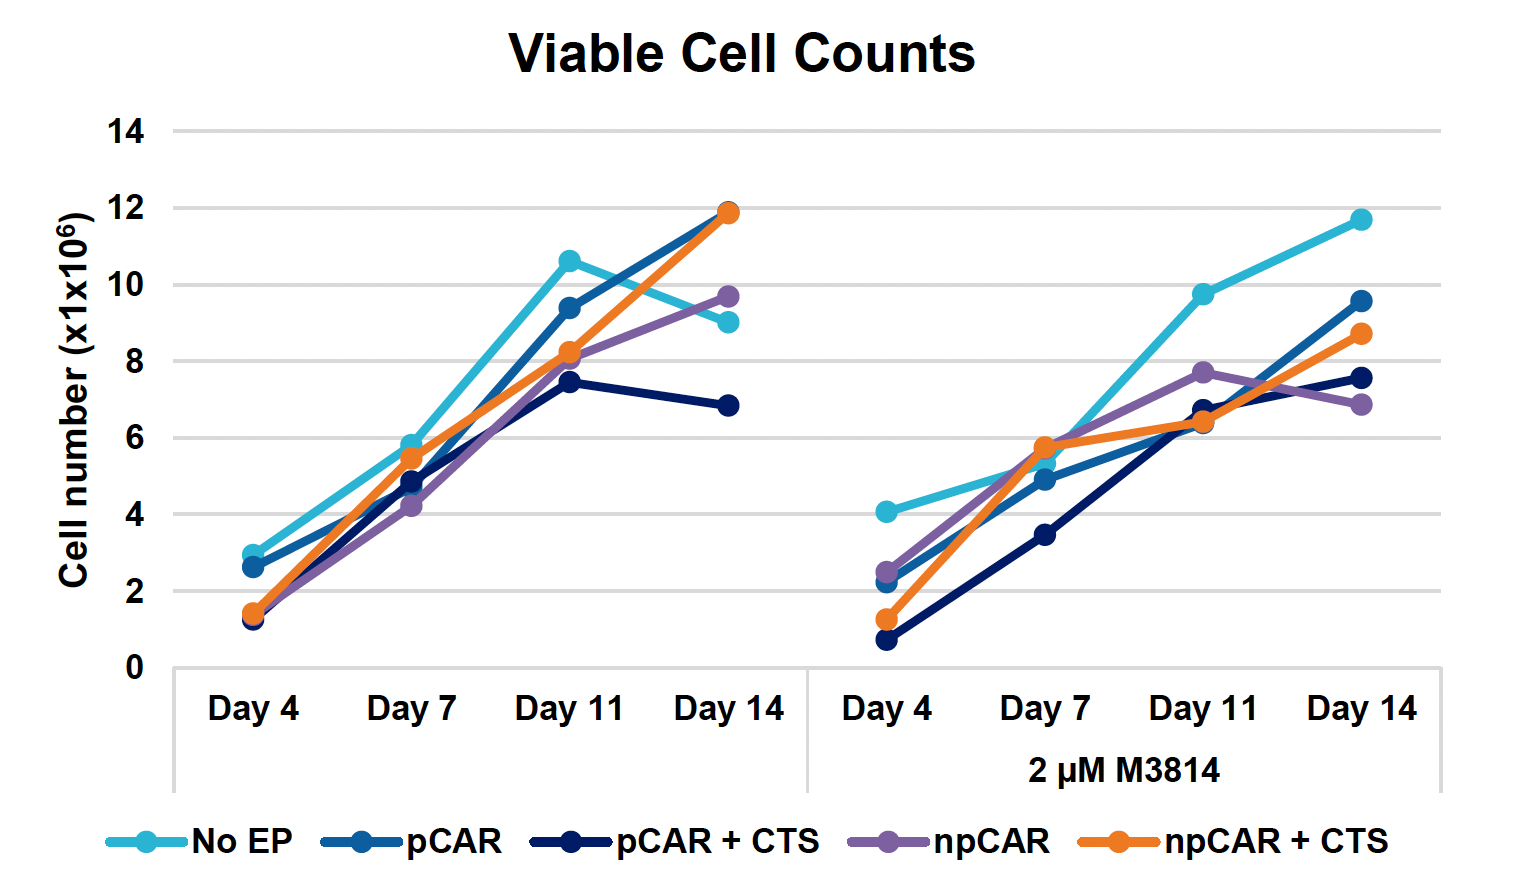
G) TRAC KO over 14-day expansion
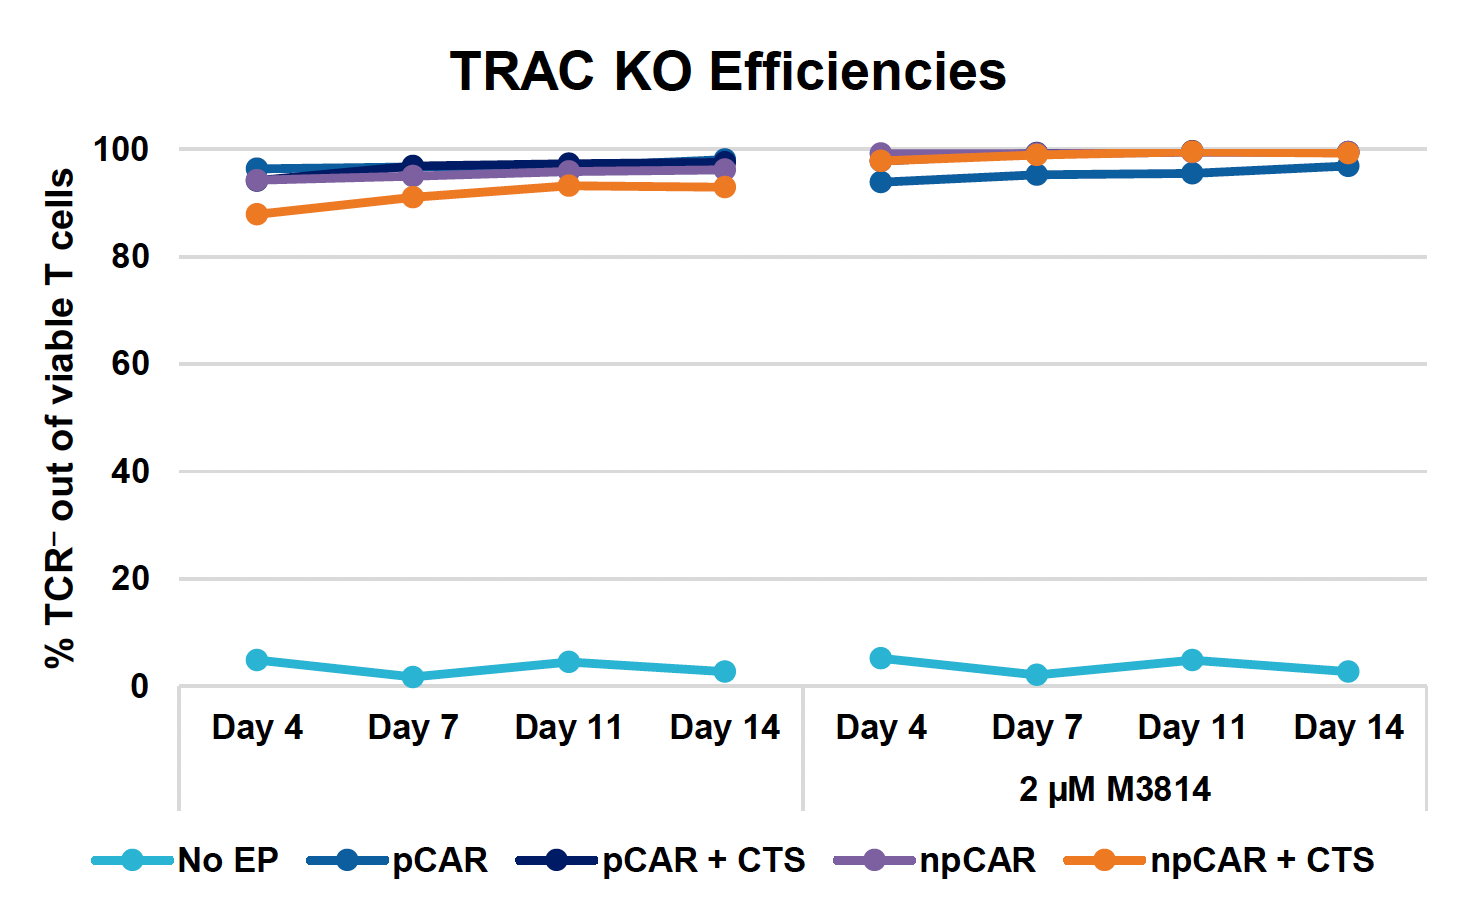
H) CAR KI over 14-day expansion

I) CAR+ T cell counts over 14-day expansion
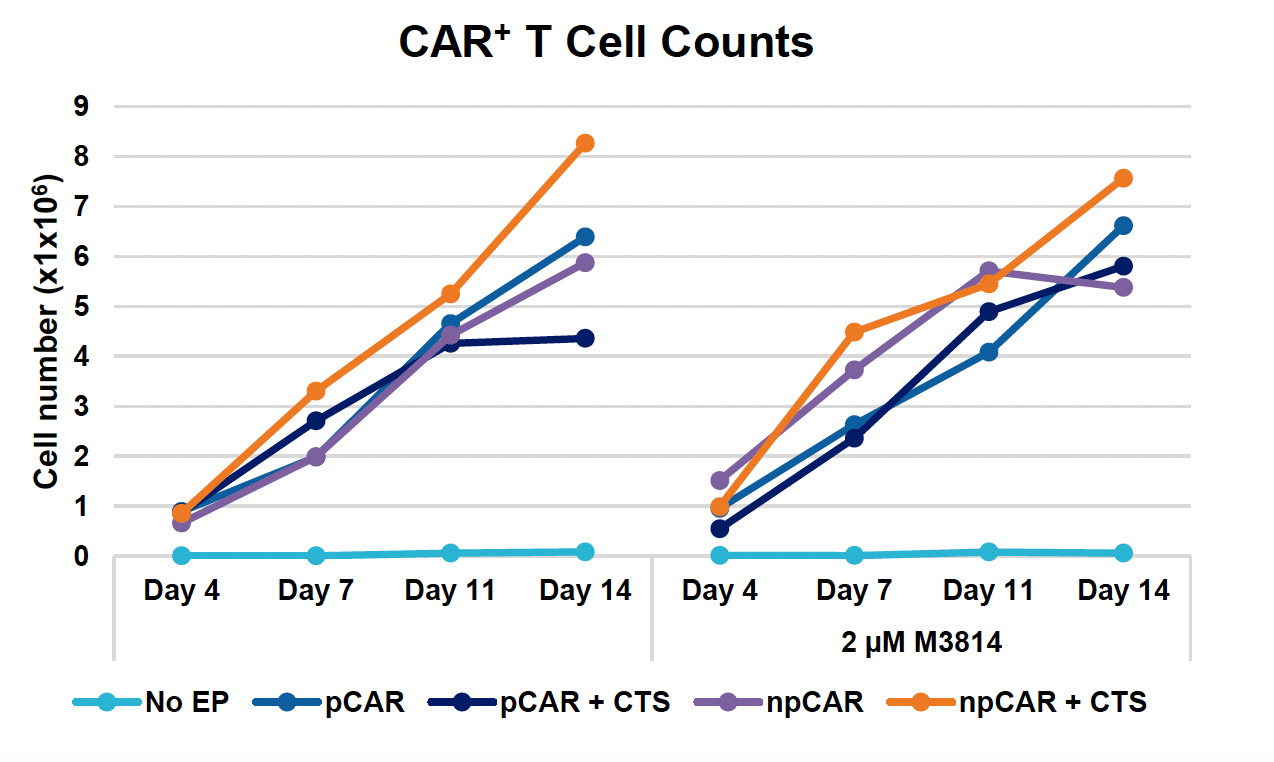
J) CAR expression over 14-day expansion
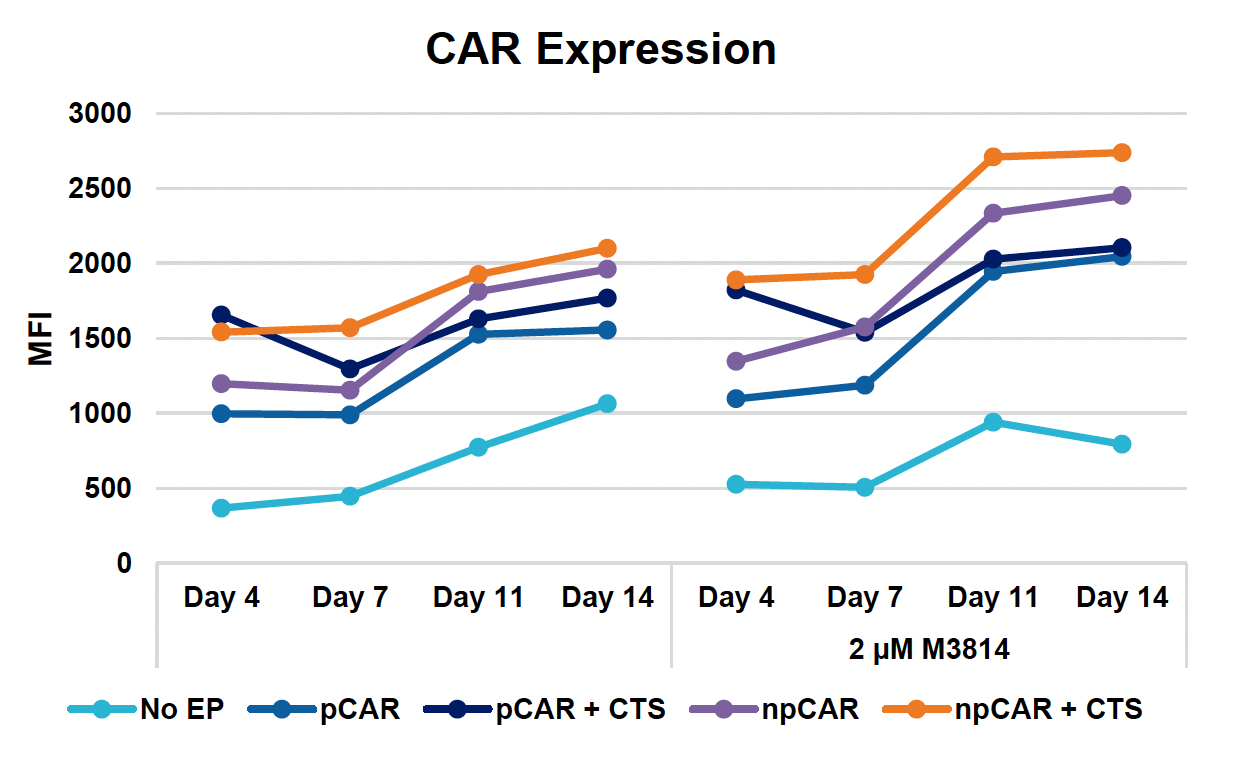
Figure 3: Optimized conditions for GFP KI were used to engineer CD19 CAR T cells using the ExPERT GTx. Activated T cells from three healthy donors were transfected with 0.5 μM of RNP and 200 μg/mL of plasmid (pCAR) or Nanoplasmid (npCAR) HDRT. Samples were split in half, and one half received 2 μM of M3814 post EP (A-D). Viable T cells (A), TRAC KO efficiencies (B), CAR KI efficiencies (C) and CAR expression (D) were measured at days four and seven post EP and demonstrate that MaxCyte can be used to reproducibly engineer CAR T cells in multiple donors. Activated T cells from the donor achieving the highest CAR KI (Donor 3) were then transfected with 0.5 μM of RNP and 200 μg/mL of different HDRTs for CD19 CAR KI including pCAR, pCAR with a CTS (pCAR + CTS). Samples were split in half, and one half received 2 μM of M3814 post EP. Cells were then expanded for 14 days (E-J). Viabilities (E), viable cell counts (F), TRAC KO efficiencies (G), CAR KI efficiencies (H), CAR+ T cell counts (I) and CAR expression (J) were measured at day four, seven, 11 and 14, and CAR T cells engineered using MaxCyte retained their ability to expand.
CAR T cells engineered using MaxCyte are functional and effective
A) Viabilities at days four, seven, 11 & 14
B) TRAC KO efficiencies at days four, seven, 11 & 14

C) CAR KI efficiencies at days four, seven, 11 & 14
D) CAR expression at days four, seven, 11 & 14
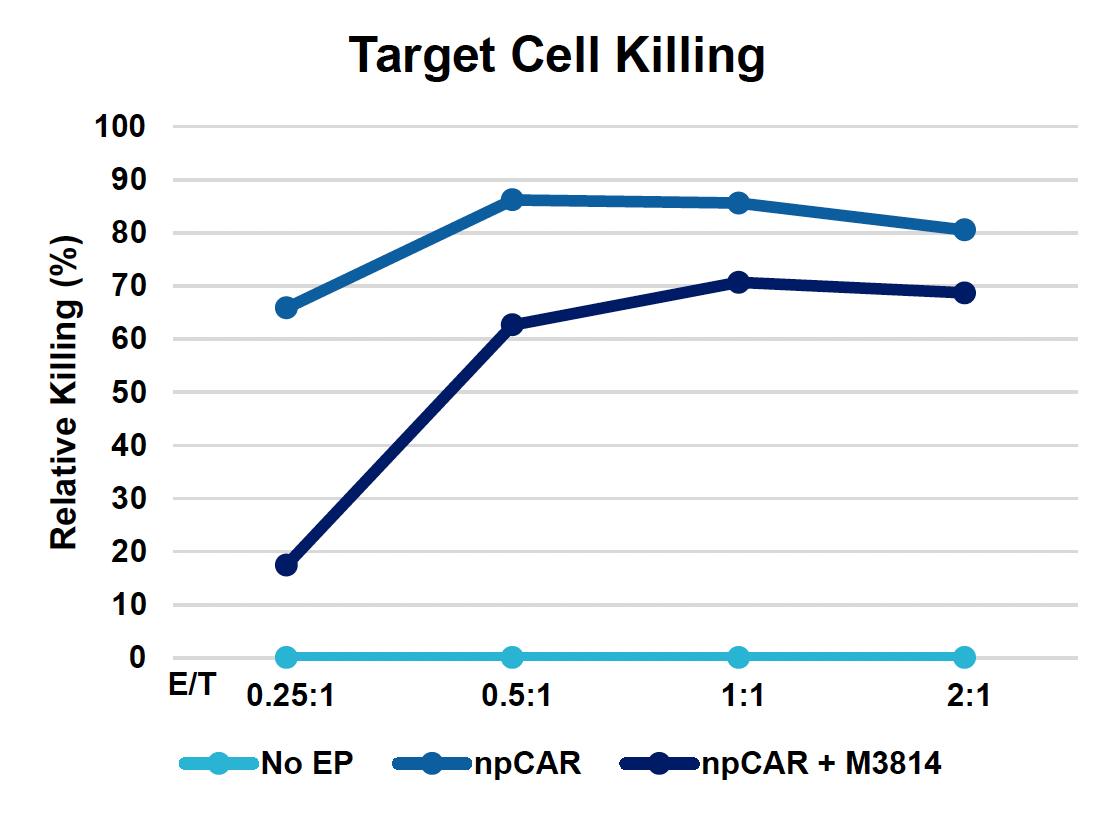
E) Target cell killing
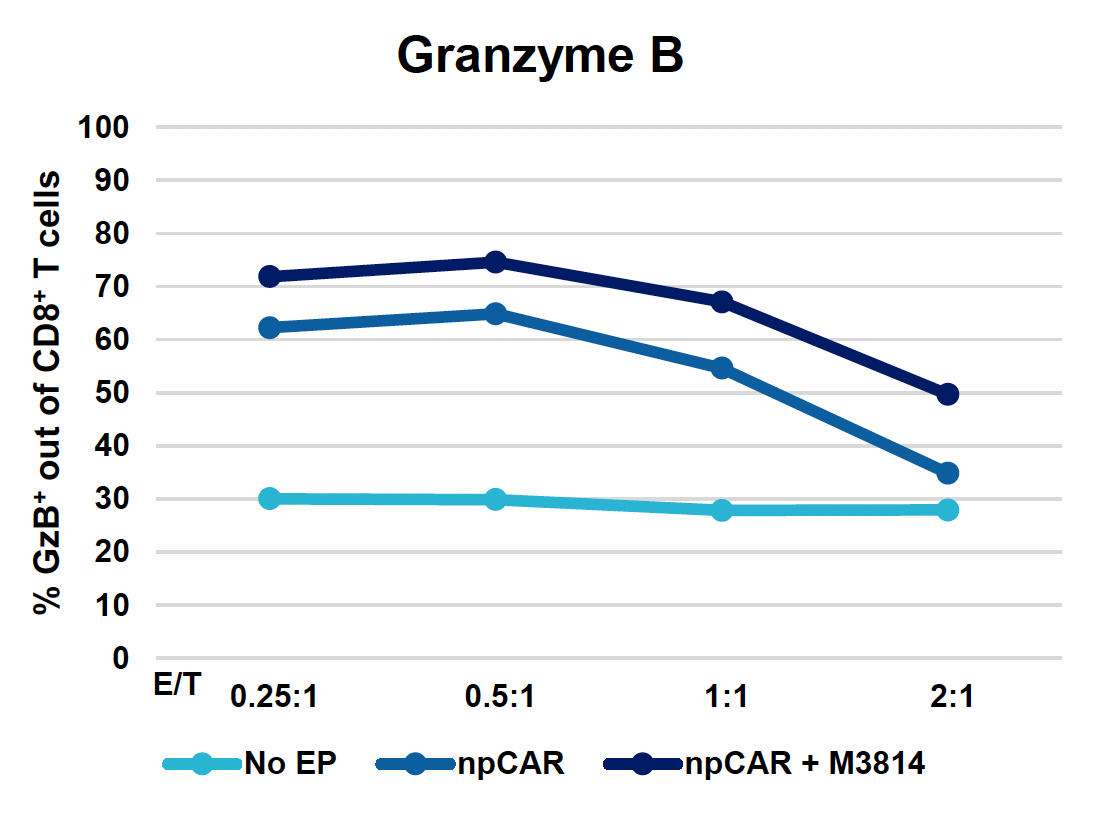
F) Granzyme B
G) IFN-γ
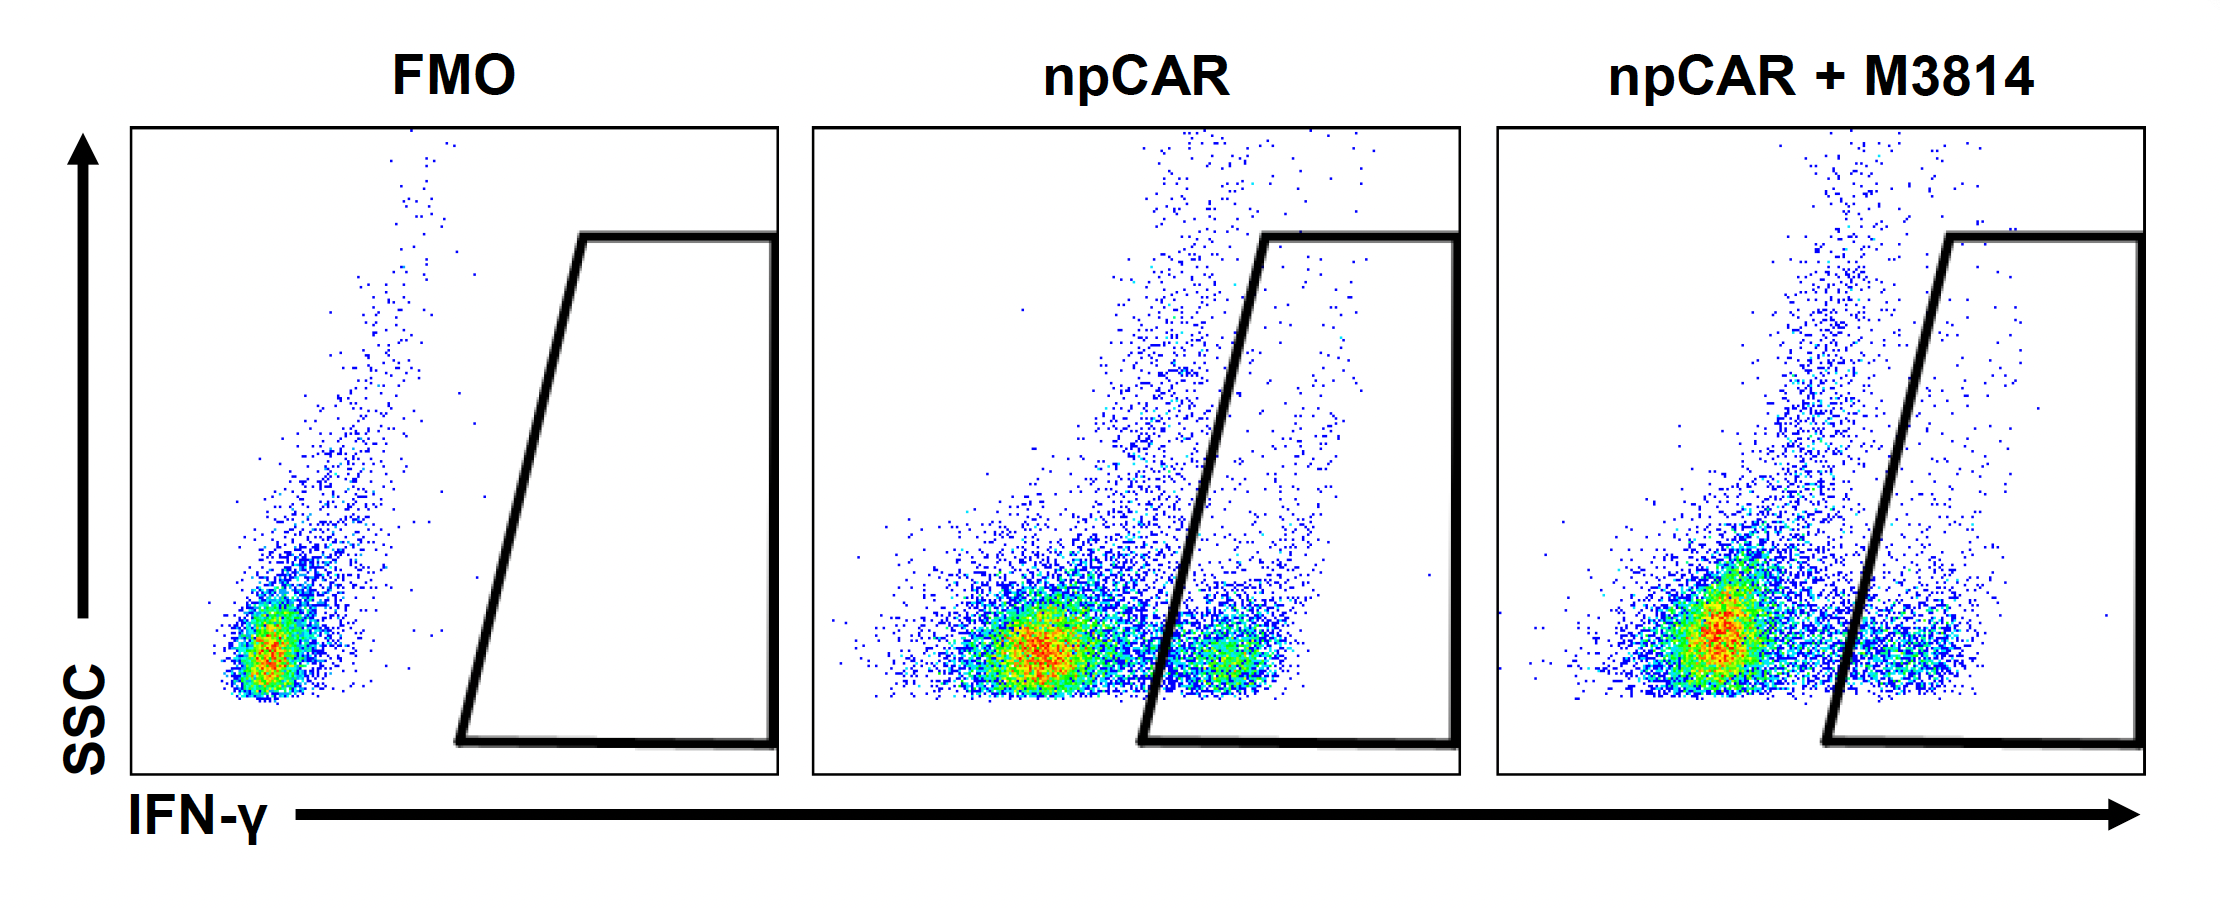
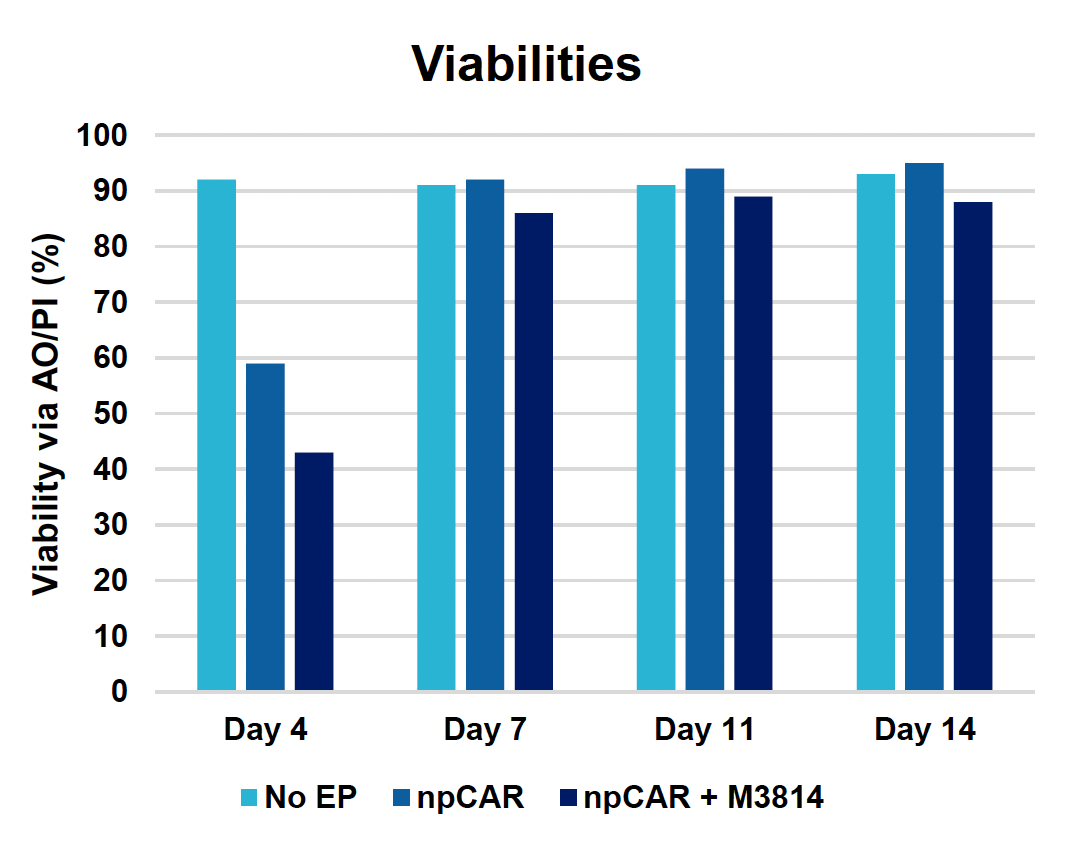
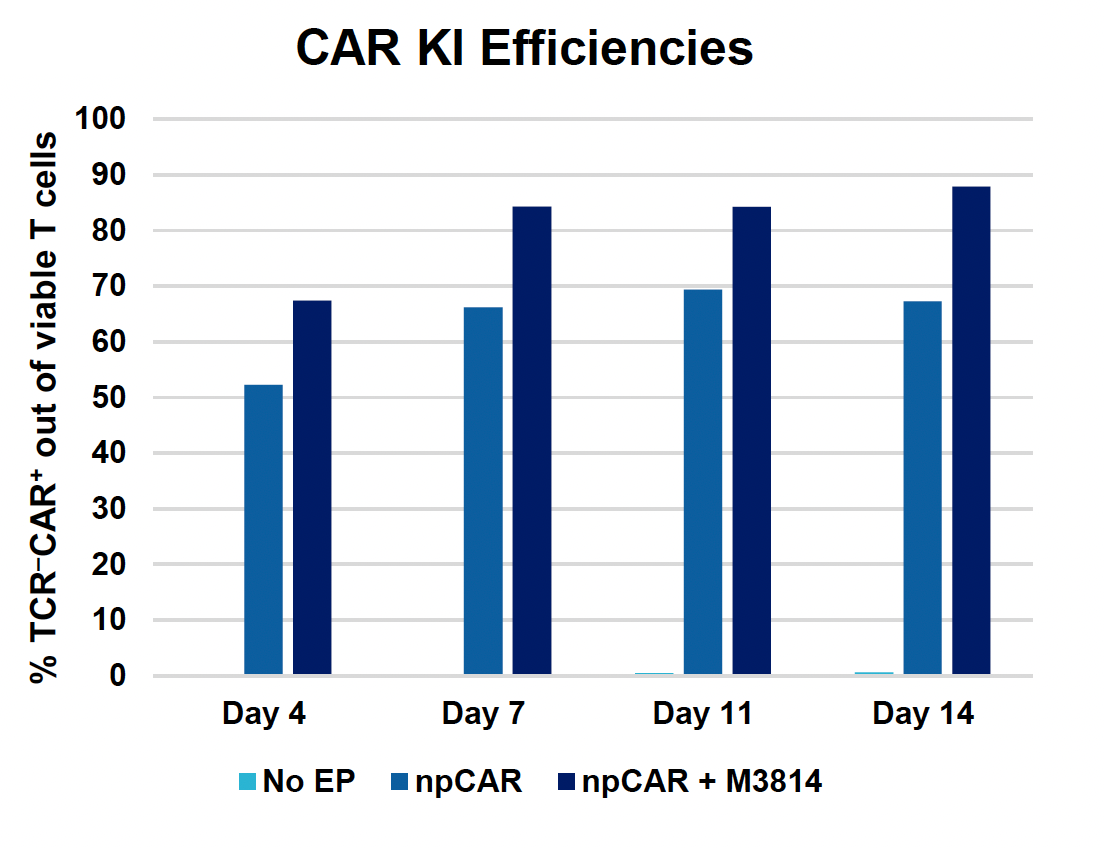
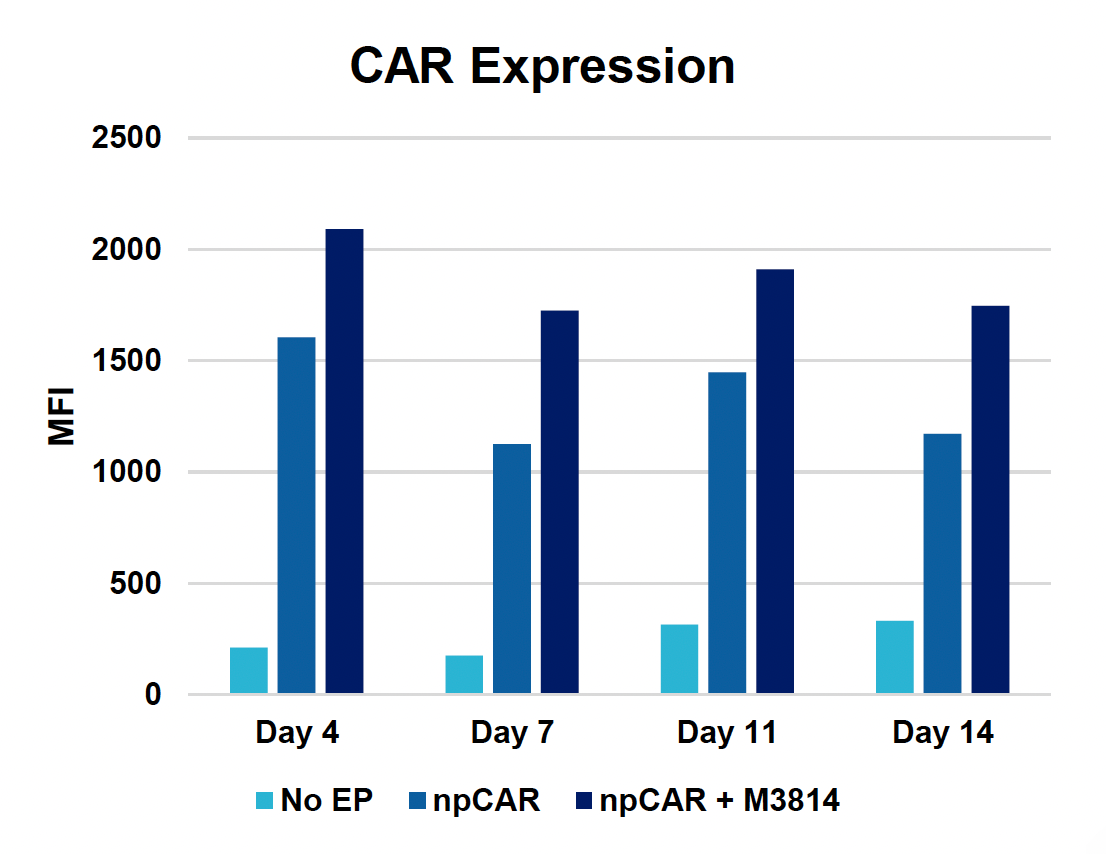
Figure 4: To assess the functionality of CAR T cells engineered using MaxCyte, 30 million activated T cells were co-transfected with 0.5 μM of RNP and 200 μg/mL of npCAR HDRT. CAR KI samples were split in half, and one half received 2 μM of M3814 post EP. Cells were then expanded for 14 days. Viabilities (A) TRAC KO efficiencies (B), CAR KI efficiencies (C) and CAR expression (D) were examined at days four, seven, 11 and 14. At day 14 post EP, CAR T cells were co-cultured with CD19+ target cells (Ramos) at varying effector-to-target (E/T) cell ratios (0.25:1, 0.5:1, 1:1. 2:1) (E-G). Target cell killing was determined via flow cytometry at 24 hours and was found to be antigen-specific and increased with higher E/T ratios (E). CD8+ CAR T cells also produced Granzyme B (GzB) in response to target cells, with those cells co-cultured at lower E/T ratios having greater intracellular GzB at 24 hours (F). CD8+ CAR T co-cultured with Ramos cells at a 1:1 E/T ratio were also shown to produced IFN-γ after 24 hours of co-culture (G), demonstrating that these cells retain their cytotoxic functions and are effective at eradicating target tumor cells.
Optimizing electroporation protocols to further improve gene knockin
A) Viable T cells

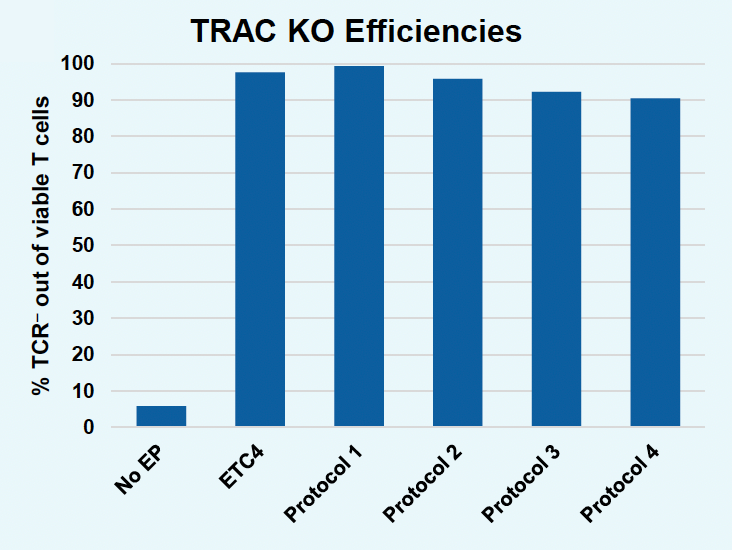
B) TRAC KO efficiencies
C) GFP KI efficiencies

D) GFP expression
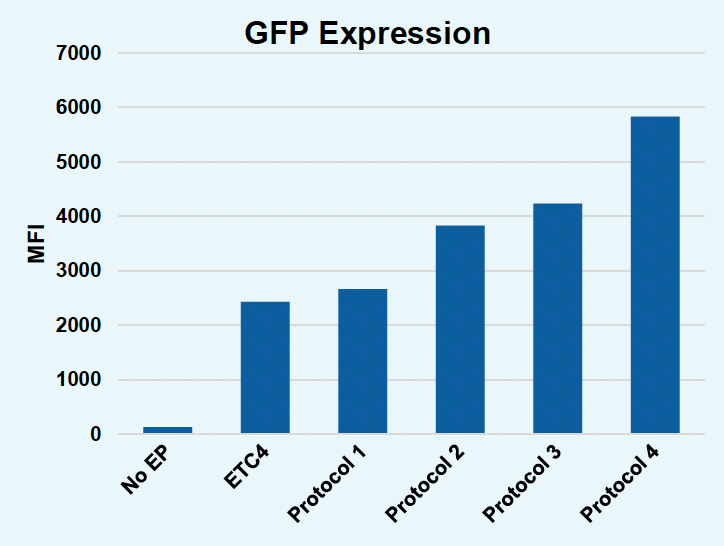
Figure 5: To further improve gene KI in activated T cells without the use of small molecule enhancers, EP protocols were further optimized. Activated T cells were co-transfected with 0.5 μM of RNP and 200 μg/mL of pGFP HDRT using ETC4 or one of four modified protocols: Protocol 1, Protocol 2, Protocol 3 or Protocol 4 (A-D). Viable T cells (A), TRAC KO efficiencies (B), GFP KI efficiencies (C) and GFP expression (D) were measured at day four post EP via flow cytometry. GFP KI efficiencies as well as GFP expression could be improved with modified EP protocols without the use of M3814 but improved gene editing occasionally came at the cost of viable T cells. Efforts are ongoing to design optimized EP protocols that ensure high gene editing without compromising cell viability or functionality using the ExPERT GTx.
Summary
- MaxCyte electroporation enables stable expression of tumor-targeting receptors in human T cells while maintaining high cell viabilities and functionality.
- Smaller HDRTs, the addition of a CTS and the use of HDR enhancers can be used alone or in combination to improve gene knockin.
- The ExPERT GTx® reproducibly engineers CAR T cells without impacting expansion, and these cells are highly effective at eradicating tumor cells.
- Optimized electroporation protocols can be used to enhance gene knockin without the need for HDR enhancers.


